Instagram Analytics: How to Track and Improve Your Performance
Tips for turning your Instagram analytics data into insights that improve content performance.
When athleisure brand Girlfriend Collective set out to grow their Instagram presence, they knew it wouldn’t be easy. In such a competitive space, simply posting more wasn’t going to cut it; they needed a data-driven strategy. By leveraging AI to analyze visual patterns in its top-performing content, the brand identified exactly what resonated with its audience and tailored future posts to match. The result? A 75% + increase in followers, powered by intentional content and a deep understanding of audience behavior.
This kind of growth is proof that Instagram analytics can be a true game-changer. In the sections below, we’ll show you how to track the right metrics and use them to boost your performance, just like Girlfriend Collective did.
TL;DR:
- Don’t wait on the TikTok ban decision; start testing alternative platforms now.
- Rednote, YouTube Shorts and Instagram Reels are the easiest transitions for short-form content.
- Explore emerging platforms like Neptune and Clapper for early-mover advantage and niche audiences.
- Shift your social commerce strategy to Pinterest, Instagram Shop or LikeShop to keep conversions strong.
- Repurpose TikTok content and invest in email, SEO and CTAs to maintain reach and engagement.
What Are Instagram Analytics?
Instagram analytics are the data and insights that show how your content is performing on the platform. They help you understand what’s working, what’s not and how to optimize your social strategy for better results.
At a basic level, Instagram Insights is the platform’s built-in analytics tool available to Business and Creator accounts. It offers high-level data on things like post reach, impressions, profile visits and audience demographics. While helpful for day-to-day monitoring, brands looking for more in-depth data may find it limiting.
That’s where third-party social media analytics tools come in. These platforms often offer deeper insights, historical data, content benchmarking, customizable reporting and competitor tracking, giving you a more holistic and comprehensive view of your performance over time.
Why Instagram Analytics Matter
Instagram analytics matter because they give you a clear view into how your audience responds to your content and how to best use social media for business growth. They help set meaningful goals, track progress and make informed decisions. Without data, it’s nearly impossible to know what’s resonating and even harder to spot where your efforts are falling flat.
As the platform continues to play a central role in the customer journey, understanding and interpreting the metrics found within your Instagram analytics is more important than ever. In fact, 62% of Instagram’s active adult users say they use the platform to research brands and products, making it the top social platform for brand discovery and evaluation in 2026.

10 Fundamental Instagram Metrics You Should Track
Tracking the right Instagram metrics is the foundation of any successful content marketing strategy. It’s how you uncover what’s connecting with your audience, learn more about your audience and make smarter decisions that drive real growth. Your Instagram analytics hold the roadmap to stronger performance and better results.
Below are the core metrics every brand should be keeping an eye on, along with actionable tips to help you improve each one.
1. Follower Growth
Track how your audience is growing over time. Steady growth signals brand health, while sudden drops can flag content misalignment or over-posting.
Tip: Promote Instagram giveaways, collaborations and high-value content (like tutorials or behind-the-scenes) to attract new followers.
2. Reach vs. Impressions
Reach measures how many unique users saw your content, while impressions count total views (including repeat ones). A high impression-to-reach ratio can indicate strong engagement.
Tip: Use trending Instagram hashtags, audio and consistent posting to increase reach, especially on Reels.
3. Engagement Rate (Likes, Comments, Shares)
This metric shows how actively your audience engages with your content through likes, comments, shares and saves, relative to your follower count or reach. These are the clearest indicators of how compelling your content really is.
Tip: Boost Instagram engagement with carousel posts, short-form videos and captions that encourage responses (“this or that,” questions, polls).
4. Story Views and Completion Rate
This shows how many users watch your Stories, and how many stick around until the end. It’s a strong indicator of how engaging and relevant your video content is from start to finish.
Tip: Keep Stories short and engaging. Use stickers (polls, sliders, quizzes) and a clear narrative to maintain viewer interest. Instagram Stories deserve a strategy of their own, and we dive deeper into how to make them stand out in our Tips for Building Engaging Story Content post.
5. Profile Visits and Website Clicks
These actions measure how well your content drives interest in your brand or products. They’re big indicators of intent and interest.
Tip: Use strong calls to action in Reels, Stories and captions (e.g., “link in bio”, “tap to learn more”) and test different link in bio tools to maximize clicks.
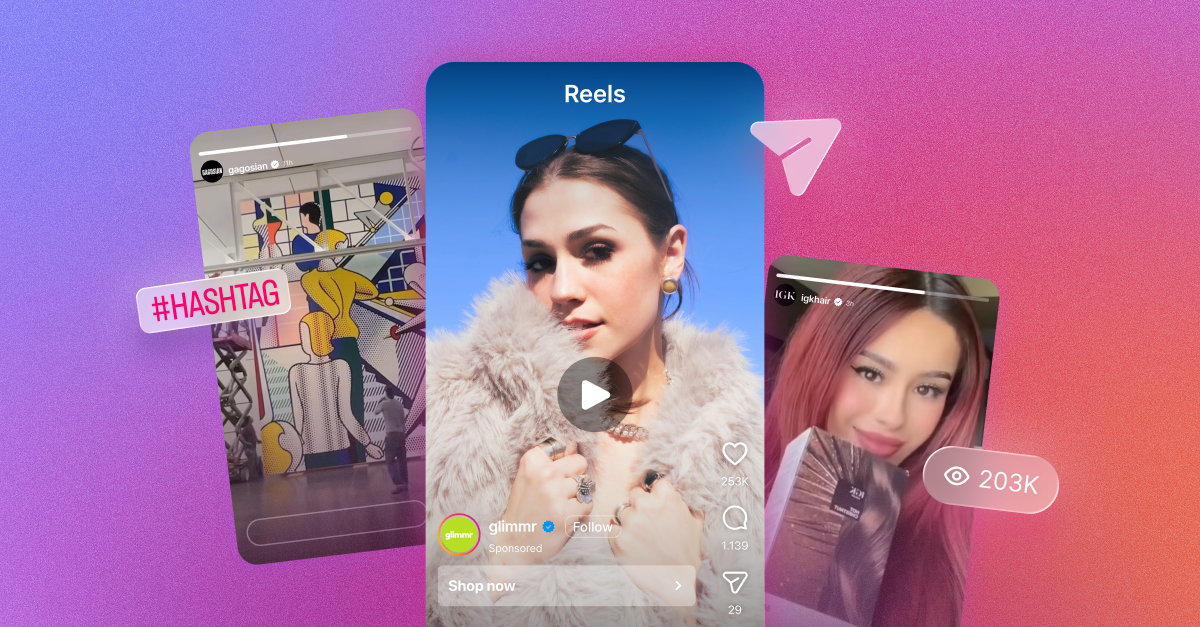
6. Reels Performance
Monitor Reels-specific metrics like plays, likes, shares and watch time to gauge what’s gaining traction. Instagram has also recently introduced a metric in the 'Insights' tab called 'When people liked your reel', so you can drill down to when your Reels earn the most engagement and post during those times.
Tip: Hook viewers in the first 3 seconds, use on-screen text (not everyone has their audio on) and lean into trending formats or audios.
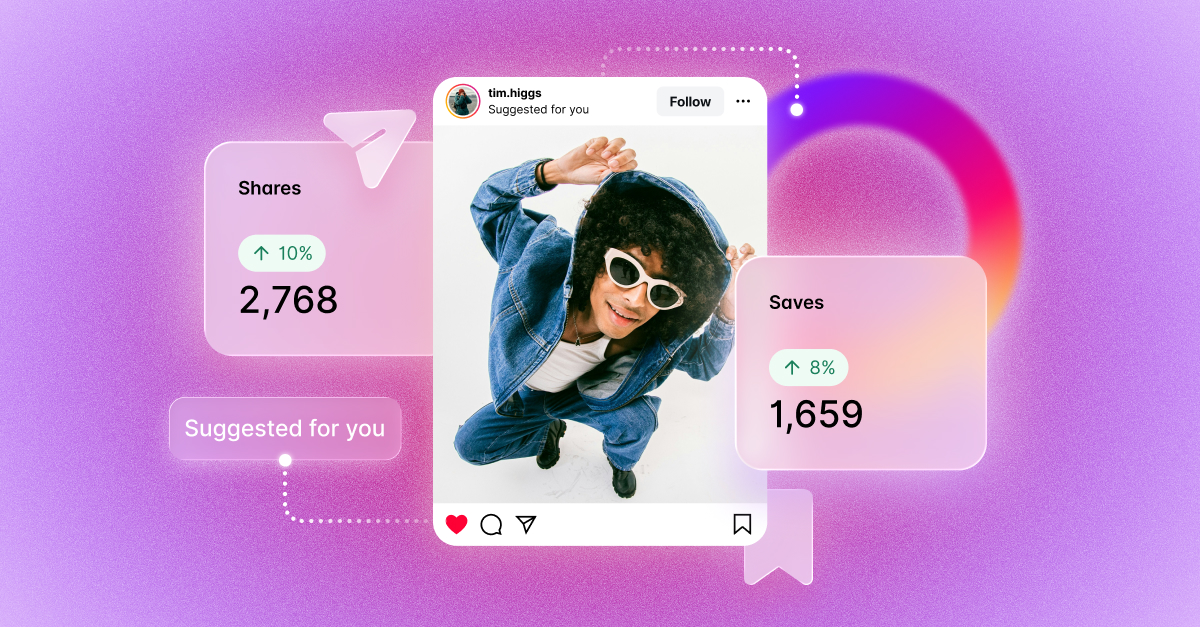
7. Saves and Shares
These are high-value engagement signals, especially to Instagram’s algorithm, indicating your content is worth revisiting or passing along.
Tip: Create educational or inspirational content that people want to keep (like checklists, recommendations or step-by-step tips).
8. Competitive Benchmarking
Benchmarking against competitors helps you uncover content gaps, assess whether you’re posting consistently enough and identify the formats and strategies driving success for others in your space.
Tip: Track engagement rates, posting frequency and follower growth of 3–5 close competitors monthly. Competitive analytics tools like Dash Social, Sprout Social or Phlanx make it easy to monitor competitive trends without manually checking every profile.
9. Carousel Performance
While a single post in your feed has its place, Carousel posts are a great way to share a series of photos in one post, which is especially helpful if you prefer a visually consistent feed, but really want to share a post that might not visually mesh with your other content. Pay attention to the 'When people liked your carousel' insight and use this data to develop a better understanding of which visuals your audience wants to see. However, some users may like your post arbitrarily or at the end of the carousel, which doesn't necessarily mean these posts are what's grabbing your audiences attention.
Tip: Pay attention to the individual images users are viewing when they like your carousel posts, and try using similar images as the 'cover' of your carousel posts to spark even more engagement. Be sure to measure the performance of these posts and adjust based on engagement metrics.
10. Post Demographics
Instagram has rolled out post-level demographics, allowing creators and business account users to see age, gender and location data for each individual post and Reel, not just aggregate account‑wide stats. Now, brands and creators can pinpoint exactly which audience segments are engaging with specific pieces of content. This granularity makes it clear what resonates with distinct segments. Ultimately, post‑level demographics give marketers deeper insight into what drives engagement and follower growth.
Tip: Once you identify which types of content resonate with high-value audience segments, create a custom Board to segment your content tailored to this brand. Analyze which posts have earned positive, neutral or negative sentiment so you can tailor your content to your target demographics more effectively.
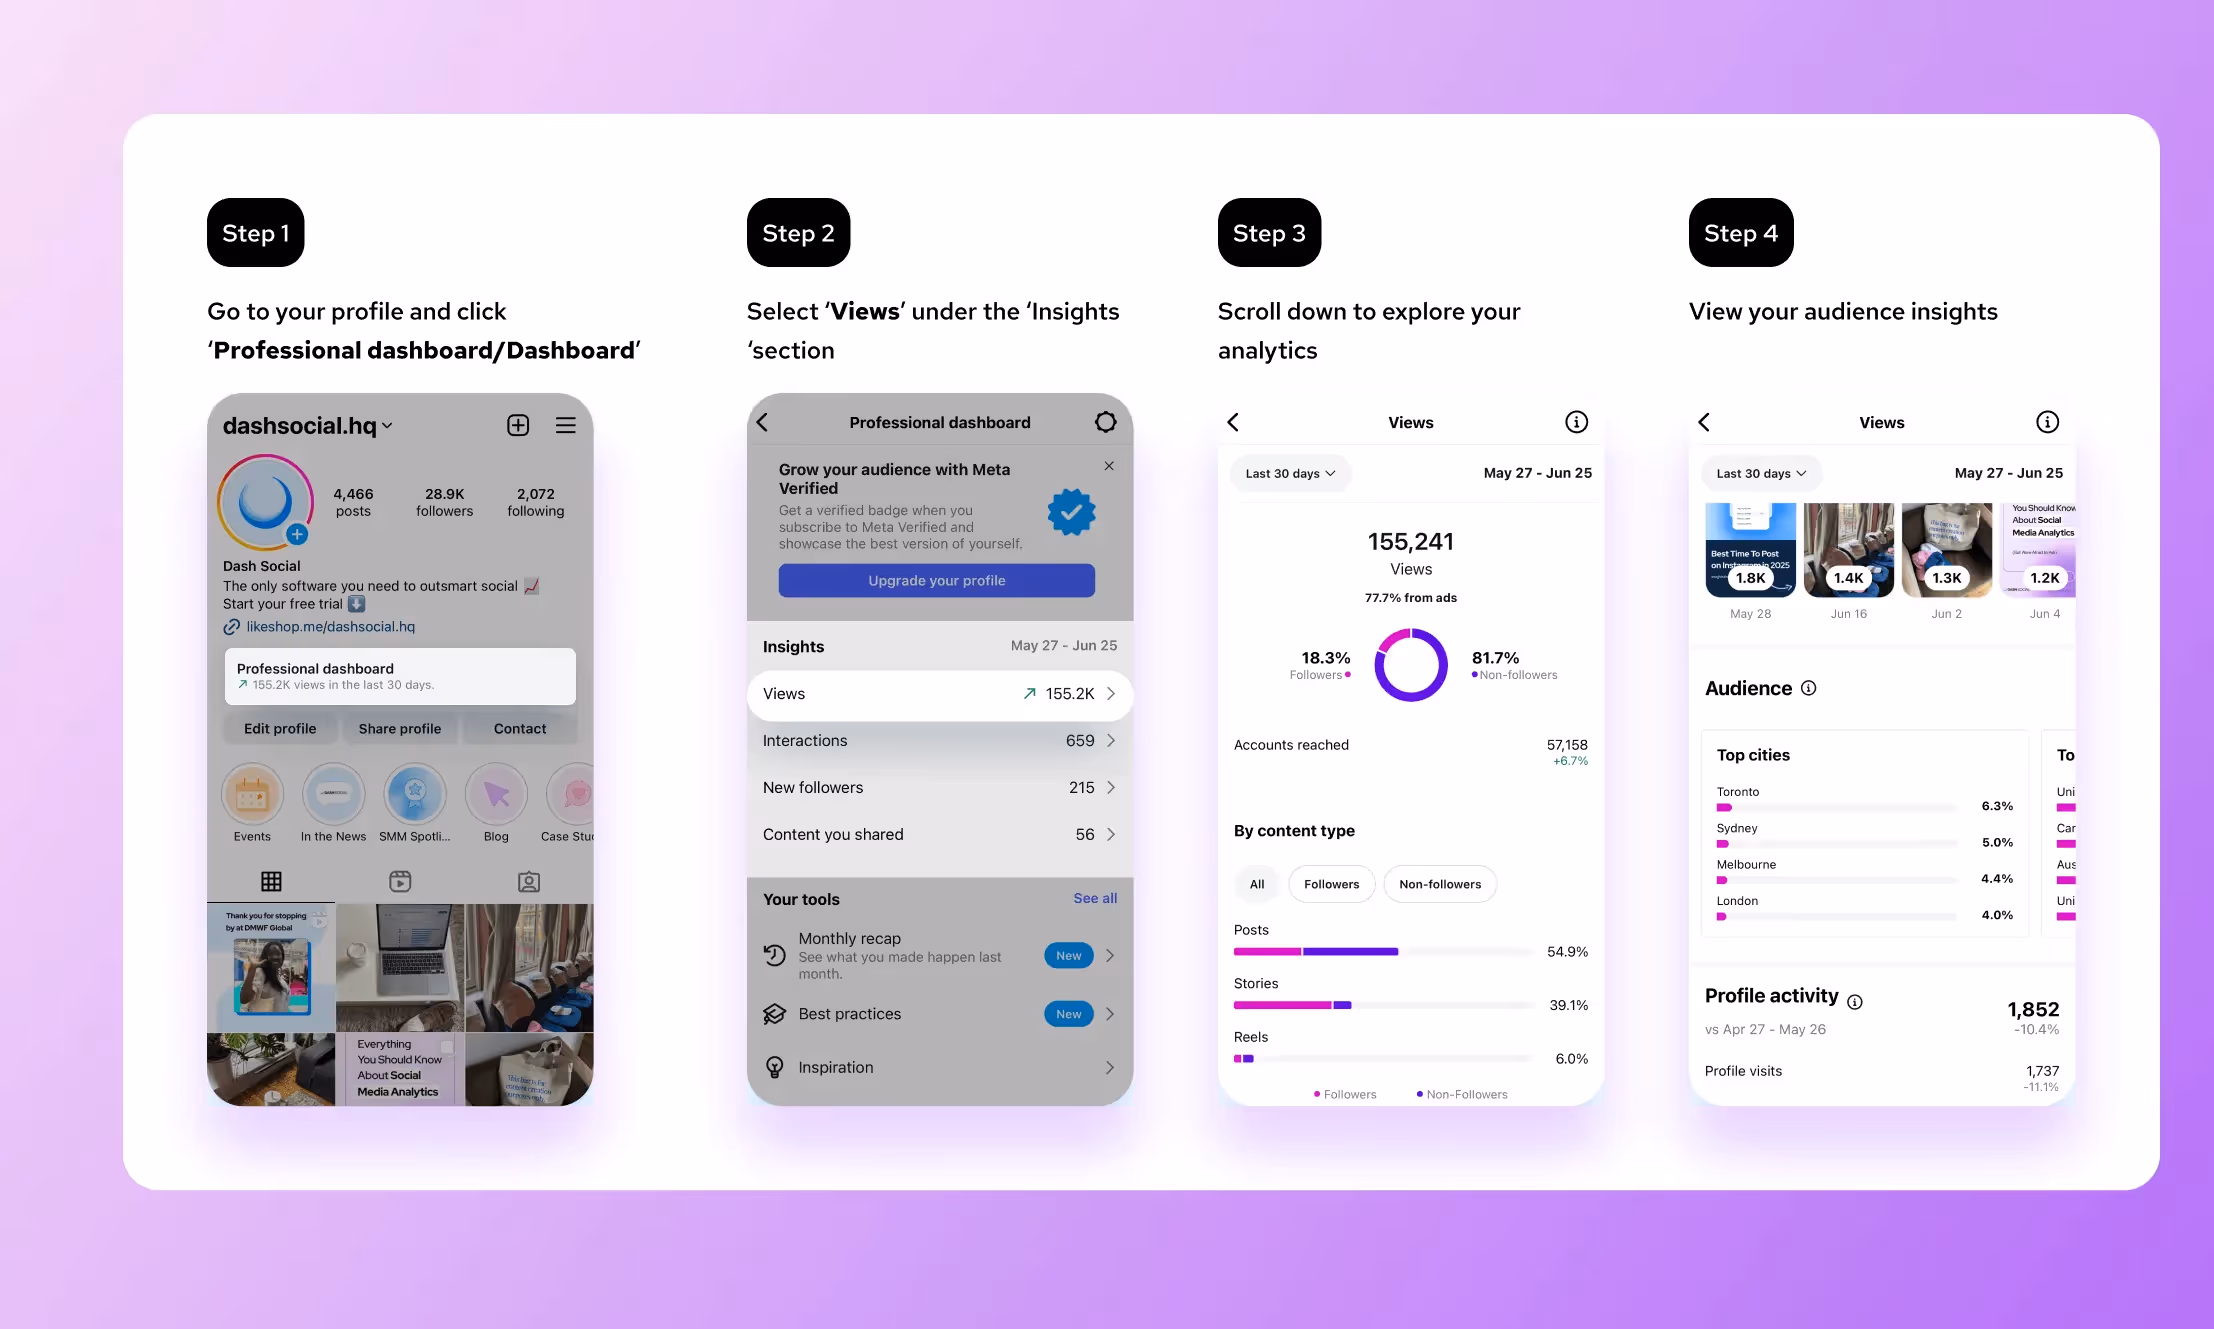
How To Access Instagram Analytics (in 4 Easy Steps)
If you have a Business or Creator account on Instagram, you can access the platform’s built-in analytics tool: Instagram Insights. It’s free, easy to use and a great starting point for tracking your content performance and understanding your audience. Here’s how to access it:
- Go to your profile, tap your profile picture in the bottom right corner of the Instagram app.
- Tap the ‘Professional Dashboard’ at the top of your profile. This is your home base for analytics and tools.
- Tap ‘See All’ next to Account Insights. This opens the full dashboard for reach, engagement, content performance and more.
- Filter by date range, choose from options like “Last 7 days,” “Last 30 days,” or set a custom range to track progress over time.
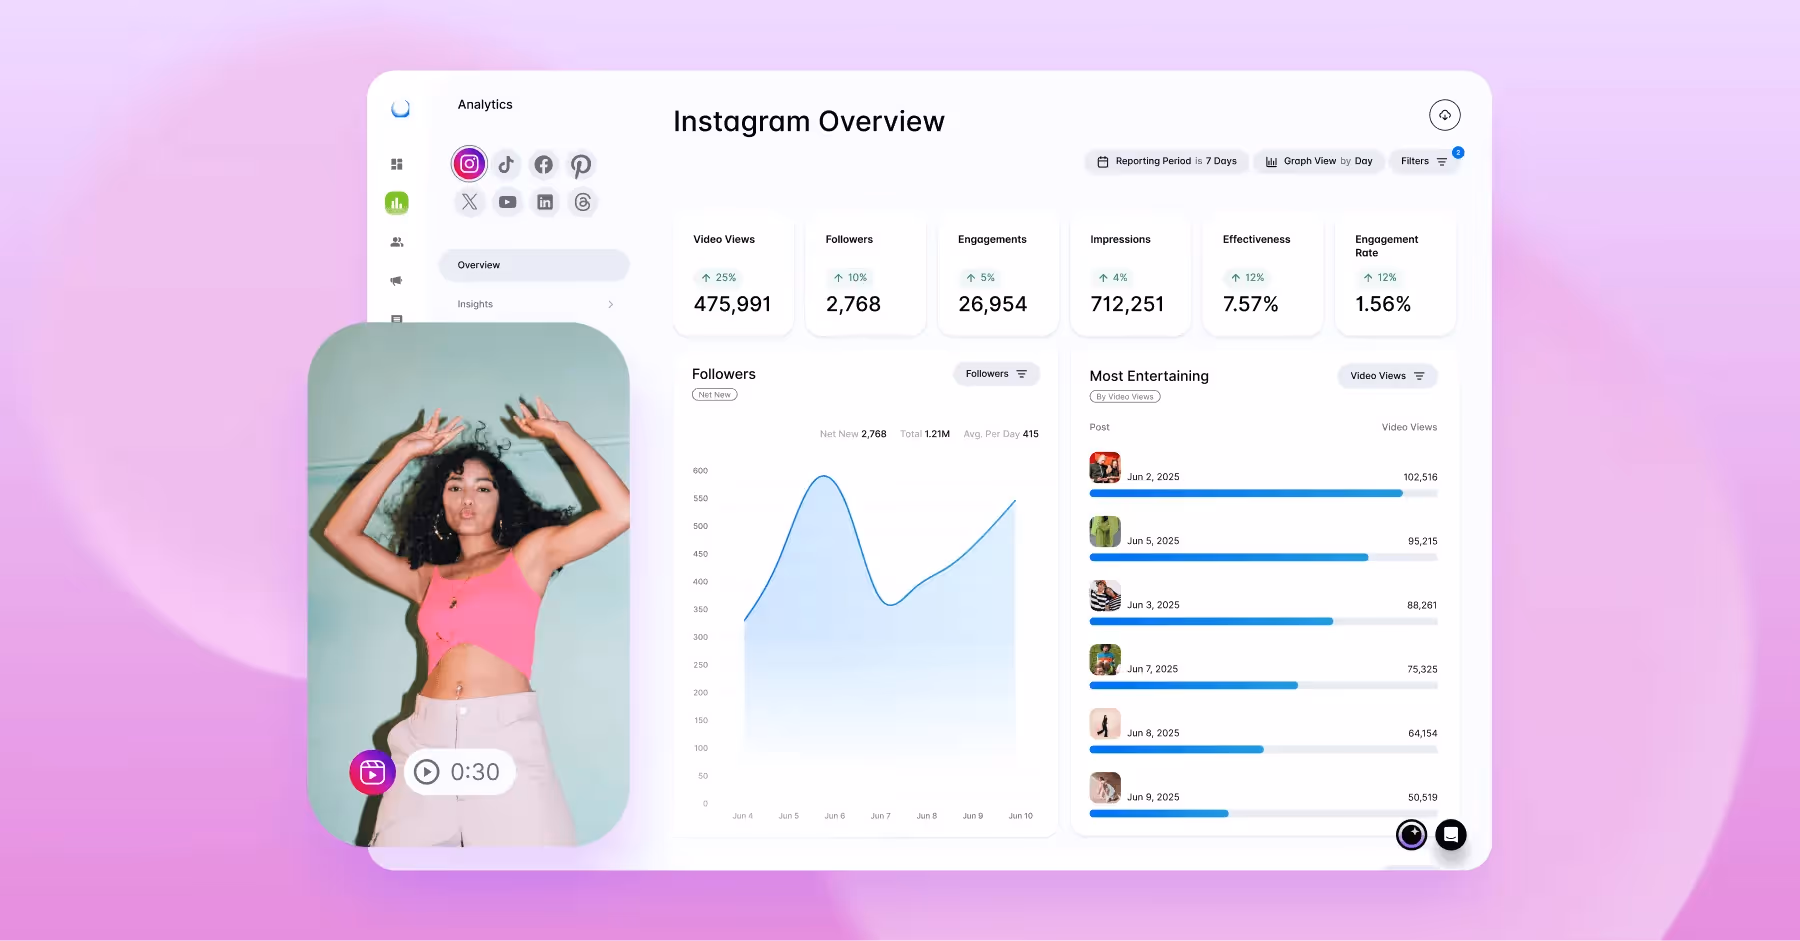
You can now explore a range of metrics within your account using any date range you choose. Here are a few great places to start:
- Overview: Get a quick snapshot of your performance, including reach, profile visits and follower growth.
- Content You Shared: Dive into detailed insights for each post, Story, Reel or Live to see what’s resonating with your audience.
- Top follower-driving content: Surface which post users viewed when they followed your account, so you can see what content contributes to follower growth.
- Audience: Track your follower growth, discover top locations, understand age and gender demographics and find out when your followers are most active.
While Instagram Insights is useful for quick checks and high-level performance stats, it does come with a few limitations:
- No competitor data: You can’t benchmark against other brands.
- Limited historical data: You can only go back up to 90 days.
- No report exports: Data has to be viewed in-app and can’t be exported natively.
- No custom dashboards: You're limited to the structure Instagram provides.
If any of these are deal-breakers for your reporting needs, keep reading. The following section covers a few powerful third-party tools that can help you level up your Instagram analytics.

Smarter Instagram Tools Built for Social Teams
Find your top posts, best times to publish and what actually drives growth.
Explore Instagram Management Tools3 Best Instagram Analytics Tools
If you’re looking to go beyond the analytics provided by Instagram Insights and get more in-depth data, custom reporting and benchmarking capabilities, these top tools are worth exploring. You can dive deeper into all of them and more in our 15 Top Instagram Tools blog post.
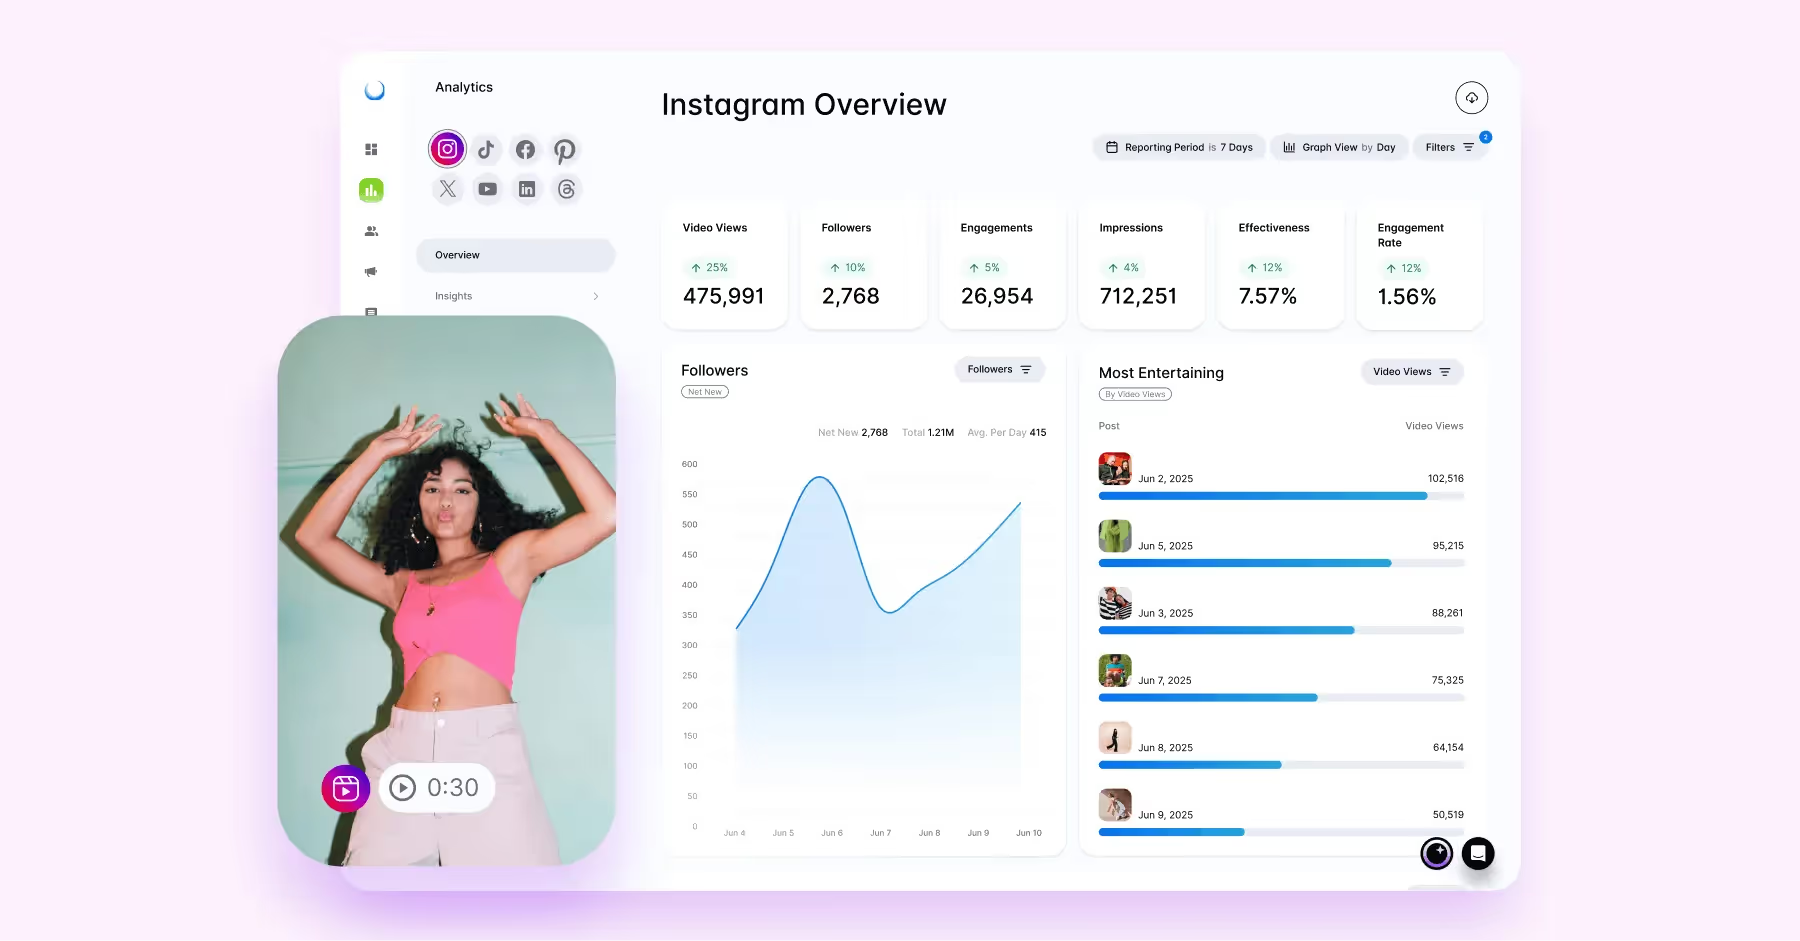
1. Dash Social
A purpose-built tool for social teams, Dash Social offers customizable reporting, campaign-level social media analytics, content tagging, AI-powered audience insights and scheduling — all in one intuitive platform. Plus, it integrates seamlessly with your existing e-commerce strategy. Just connect your product feed once, and you're set.
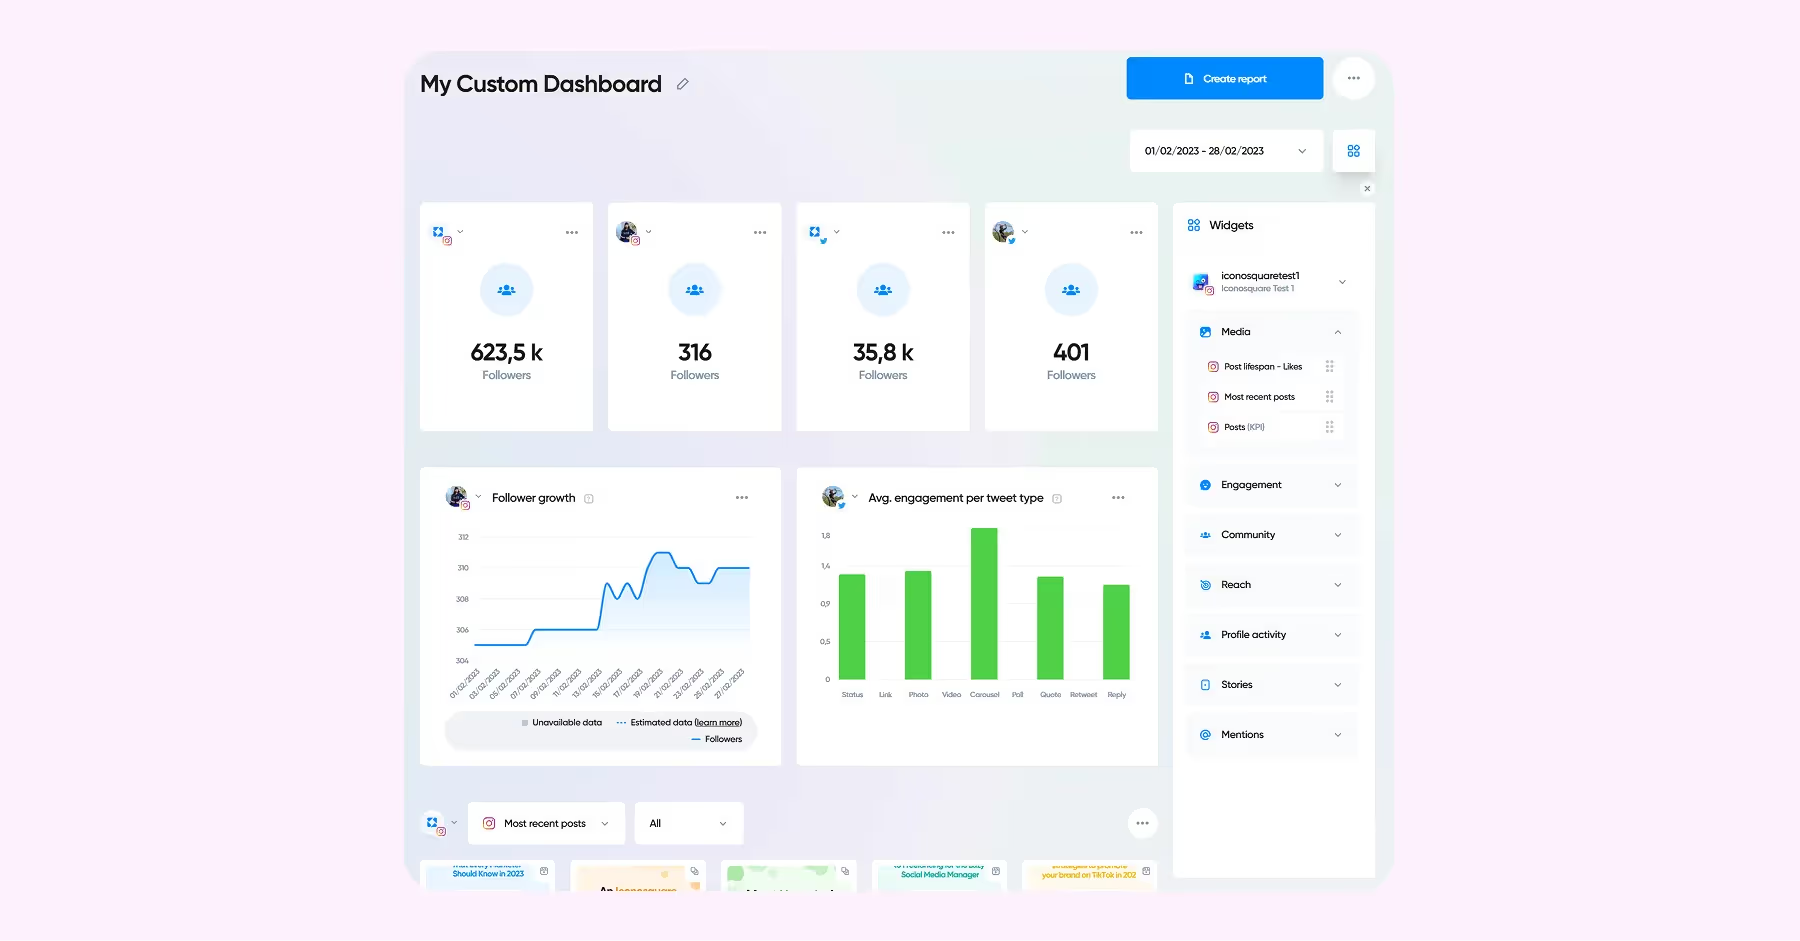
2. Iconosquare
Iconosquare is the most budget-friendly option on our list. Its entry-level plans include standard reporting features, while higher-tier packages offer more advanced analytics and light competitive benchmarking.
Thanks to its accessible pricing, Iconosquare is a great fit for small businesses, independent marketers or anyone just starting to level up their Instagram marketing strategy without breaking the bank.
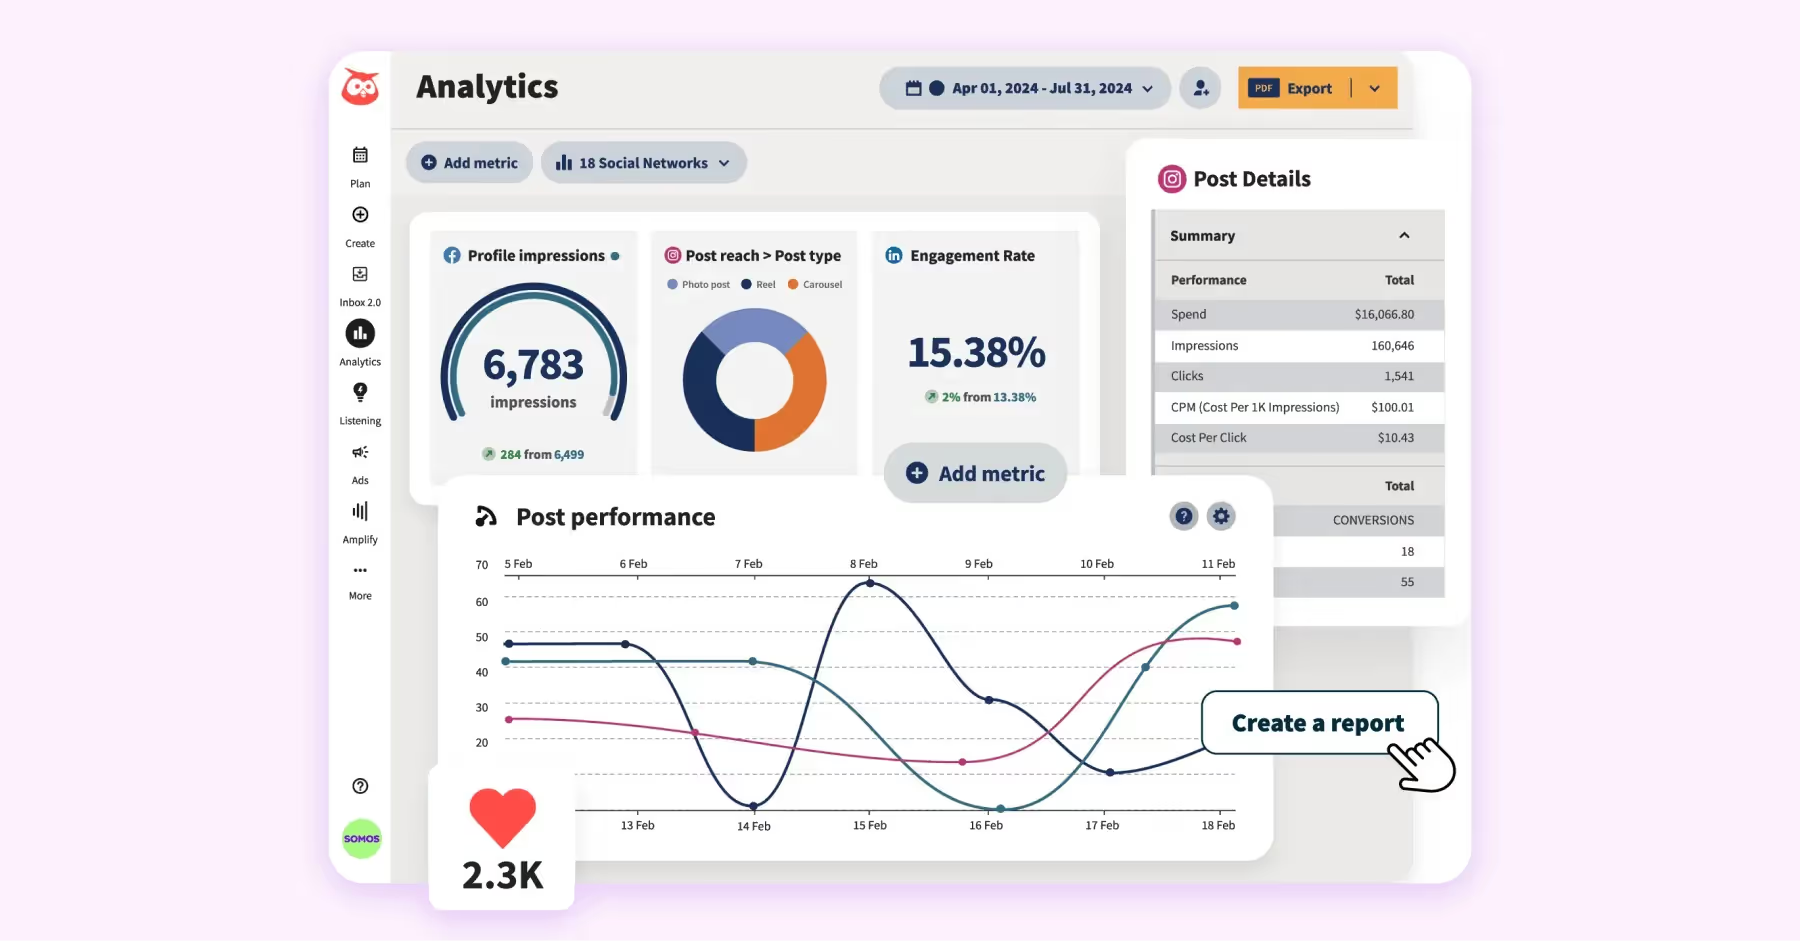
3. Hootsuite
Although Hootsuite is primarily known as a scheduling and social media management tool, it also offers analytics features including engagement tracking, post performance comparisons and basic reporting capabilities.
Priced at $99 per month for the entry-level standard package, Hootsuite is a solid mid-range option for individuals or small teams seeking a balance between functionality and cost. However, fast-growing teams should be cautious, as the pricing is per user and can add up quickly.
How To Use Analytics To Improve Performance
Instagram analytics aren’t just for reporting; if used strategically, they can be an effective instrument for refining your content strategy. When growth feels stagnant or performance plateaus, digging into your data can unearth opportunities to fine-tune your content and reignite momentum. Here are some of the most effective ways to leverage performance insights to expand your reach and boost engagement:
Content-Type Optimization
An easy first step to improving performance is analyzing which content formats generate the most engagement. Whether it’s Reels, photos, carousels or Stories, your analytics will reveal what resonates most with your audience. Lean into what works and double down. Think of your analytics as a built-in focus group: they're constantly providing feedback, no surveys required.
Posting Time and Frequency Adjustments
Identify your best time to post on Instagram and optimize your content calendar. Use data on when your followers are most active to refine your posting schedule, your carousel posts and test how often you post to find the sweet spot for visibility without fatigue.
Hashtag Performance Tracking
Track which hashtags drive the most impressions and reach to refine your strategy over time. Instagram analytics help you spot which tags are actually working and which ones are falling flat or oversaturated. To level up, use competitive analysis to discover fresh, relevant hashtags your competitors are using that you haven’t tapped into yet.
Audience Demographic Insights
Understanding who’s engaging with your content is important for creating posts that resonate. Using demographic data like age, gender and location can help shape your content strategy, adjust your tone and ensure you’re posting at optimal times. You’re more likely to drive meaningful engagement and build stronger connections by aligning your messaging with your audience's interests and behaviors.
A/B Testing for Captions and CTAs
Small tweaks can lead to big results. Test different caption styles, tones and calls-to-action (like “Save this post” vs “Comment below”) to see which variations drive the most engagement, clicks or conversions. Over time, these insights help you craft more compelling, action-driven posts that speak directly to what motivates your audience.
Common Mistakes to Avoid
Even with the right tools, it’s easy to fall into a few analytics traps. Keep an eye out for these common missteps:
✘ Focusing on vanity metrics: High likes and follower counts may look impressive, but they don’t always translate to real impact. Prioritize metrics that reflect meaningful engagement and conversions.
✘ Ignoring Stories and Reels analytics: These high-impact formats often drive reach and engagement but are easy to overlook in reporting. Regularly review Reels and Instagram Stories analytics performance to spot trends and content opportunities.
✘ Not benchmarking against industry standards: Without context, your performance data only tells part of the story. Are you doing well or just okay? Use competitive benchmarks to set smarter goals.

Instagram Analytics FAQs
Which Instagram analytics metrics are most important?
The most important Instagram metrics to track depend on your goals, but here are a few that matter most across the board:
- Engagement Rate: Measures how actively your audience interacts with your content (likes, comments, shares, saves) relative to your follower count. This shows how resonant and relevant your posts are.
- Reach: Indicates how many unique users have seen your content. It's key for understanding your brand’s visibility and content discoverability.
- Impressions: Tracks the total number of times your content was displayed. While similar to reach, it accounts for multiple views from the same users, which is helpful for spotting repeated exposure.
- Follower Growth: Monitoring follower gains (or losses) helps you evaluate how your content, campaigns or events impact audience expansion.
- Profile Activity (e.g., Profile Visits, Website Clicks, Email Taps): These actions indicate interest beyond a single post—they reflect deeper intent and can signal conversion opportunities.
- Story and Reel Performance: Taps forward/backward, exits and completion rates tell you how engaging your short-form content is. With Stories and Reels driving major reach, these metrics shouldn’t be ignored.
- Best Time to Post: Found within audience insights, this helps you optimize your posting schedule for maximum engagement.
What is the difference between Instagram analytics and insights?
Instagram Insights is the built-in tool available in the app. It offers basic metrics like reach, impressions, follower growth and post performance, making it great for quick checks.
Instagram Analytics is a broader term that often refers to actual metrics or third-party tools offering deeper data, custom reports, historical trends and competitor benchmarking. Ideal for more advanced strategy and reporting.
Are Instagram analytics accurate?
Yes, Instagram analytics are accurate for in-app activity like reach, impressions and engagement. However, they’re limited to the past 90 days and may not capture external interactions. For deeper or long-term insights, third-party tools are more reliable.