Instagram Stories Analytics: How To Measure And Track Performance
Get the insights you need to measure, optimize and grow your Instagram Stories.
Contents
What Are Instagram Story Analytics?Key Instagram Story Metrics To TrackInstagram Story Navigation ExplainedHow To Use the Instagram Story DashboardHow To View Your Instagram Story AnalyticsHow To Turn Story Insights Into a Reporting WorkflowInstagram Story Analytics for Brands vs. CreatorsHow To Use Analytics To Improve Your Stories PerformanceMore Tips and Best Practices for Instagram StoriesTop 3 Instagram Story Analytics Tools for Advanced InsightsInstagram Story Analytics FAQsInstagram Stories can tell you a lot about how your audience behaves. Every tap forward, exit, reply, link click, and profile visit gives you a clearer picture of what’s holding attention, what’s driving action, and where people are dropping off.
In this guide, we’ll break down the Instagram Story analytics that actually matter, including what exits, taps forward, navigation, and next story mean, how to use the Instagram Story dashboard, and how to build a reporting workflow that connects Story performance to reach, engagement, and conversions.
We’ll also cover Instagram’s native analytics limitations and how brands use third-party tools to compare Story performance across campaigns, content types, and reporting periods for more advanced reporting.
Key Takeaways:
- Instagram Story analytics fall into three main categories: navigational, discovery, and engagement metrics.
- Navigation metrics such as exits, forward taps, and next Story swipes reveal where viewers lose interest or remain engaged.
- Reach, views, profile visits, and website clicks help measure awareness, audience growth, and business impact.
- Consistent reporting helps brands identify high-performing content, improve retention, and optimize future Stories.
What Are Instagram Story Analytics?
Instagram Story analytics are metrics that help you measure how effectively your Stories reach, engage, and convert your audience. With a wide range of social media analytics available, brands and creators can set custom goals and track performance to better inform their future Stories strategy.
The challenge is knowing which metrics matter most. Instagram provides dozens of data points, and each metric tells a different part of the story. Monitoring these key performance indicators (KPIs) is needed to ensure you're creating the right content and keeping your audience's attention. In the sections below, we'll break down the most important Instagram Story metrics, explain what each one means, and show you how to use them to improve performance over time.
Key Instagram Story Metrics To Track
Instagram Story metrics generally fall into three categories: navigational, discovery, and engagement metrics. Looking at these groups separately makes it easier to understand how people find your Stories, how they move through them, and what actions they take next.
Discovery Metrics
Discovery metrics show how many people your Stories reach and whether those viewers take actions that grow your audience or business. These metrics are especially important if your goal is awareness, follower growth, website traffic, or local business activity.
Engagement Metrics
Engagement metrics show how viewers interact with your Stories. These are often the strongest indicators of whether your content is interesting, useful, persuasive, or worth continuing.
While tracking likes, replies, shares, and sticker taps is important, it's equally valuable to understand how your performance compares to other accounts. Reviewing Instagram Stories benchmarks can help you identify what's typical for your industry and set realistic goals for improving engagement.
Navigational Metrics
Navigational metrics reveal how viewers progress through your Instagram Stories from start to finish. These are especially useful for spotting whether your Stories are holding audience attention or causing people to leave.
Instagram Story Navigation Explained
Looking at navigation metrics individually is useful, but the real value comes from analyzing them together. Patterns in behavior can reveal whether your Story pacing is effective, whether messages are landing and where audiences lose interest.
For example, a Story with strong reach but high exits may be attracting viewers without holding their attention. Likewise, high backward taps can signal that a frame contains particularly useful or compelling information.
Here’s how to read common Instagram Story navigation patterns:
For brands, navigation data is especially useful when reviewing campaign Stories. If viewers consistently drop before the link sticker or final product frame, the issue might not be the CTA itself. The problem could be the Story sequence leading up to it.
Forward vs. Next Story: What’s the Difference?
Forward taps and next Story swipes sound similar, but they measure two very different behaviors.
A forward tap means someone tapped to move from one frame of your Story to the next frame in your sequence. But this doesn’t always mean they disliked the content. People often tap forward naturally, especially if they read quickly or already understand the message.
A next Story swipe means someone swiped away from your Story and moved to another account’s Story. This is a stronger sign that the viewer is leaving your content. If next Story swipes are high, you may not be grabbing attention, matching audience intent, or delivering value quickly enough.
In simple terms:
If you’re trying to improve retention, pay close attention to the difference. Forward taps may mean your pacing needs work. Next Story swipes often mean your hook, topic, or creative direction needs work.
What Does Exited Mean on Instagram Story Insights?
Exited on Instagram Story Insights means someone left the Stories experience from your Story. This could mean they closed Instagram, returned to their feed, visited another part of the app, or stopped watching Stories altogether.
A high exit rate can happen for a few reasons. Sometimes it means your Story was the natural end of a viewing session. But if exits spike before your CTA, link sticker, or most important message, it may mean the sequence is too long, the content is not engaging enough, or people don’t understand why they should keep watching.
To reduce exits, review where people leave and ask:
- Is the first frame clear and interesting?
- Are we taking too long to get to the point?
- Is the CTA too late in the sequence?
- Are there too many similar frames in a row?
- Does each frame give viewers a reason to keep watching?
For campaign reporting, exit rate is especially useful when paired with completion rate, link clicks, and replies. Together, these metrics show whether your Stories are holding attention and driving action.
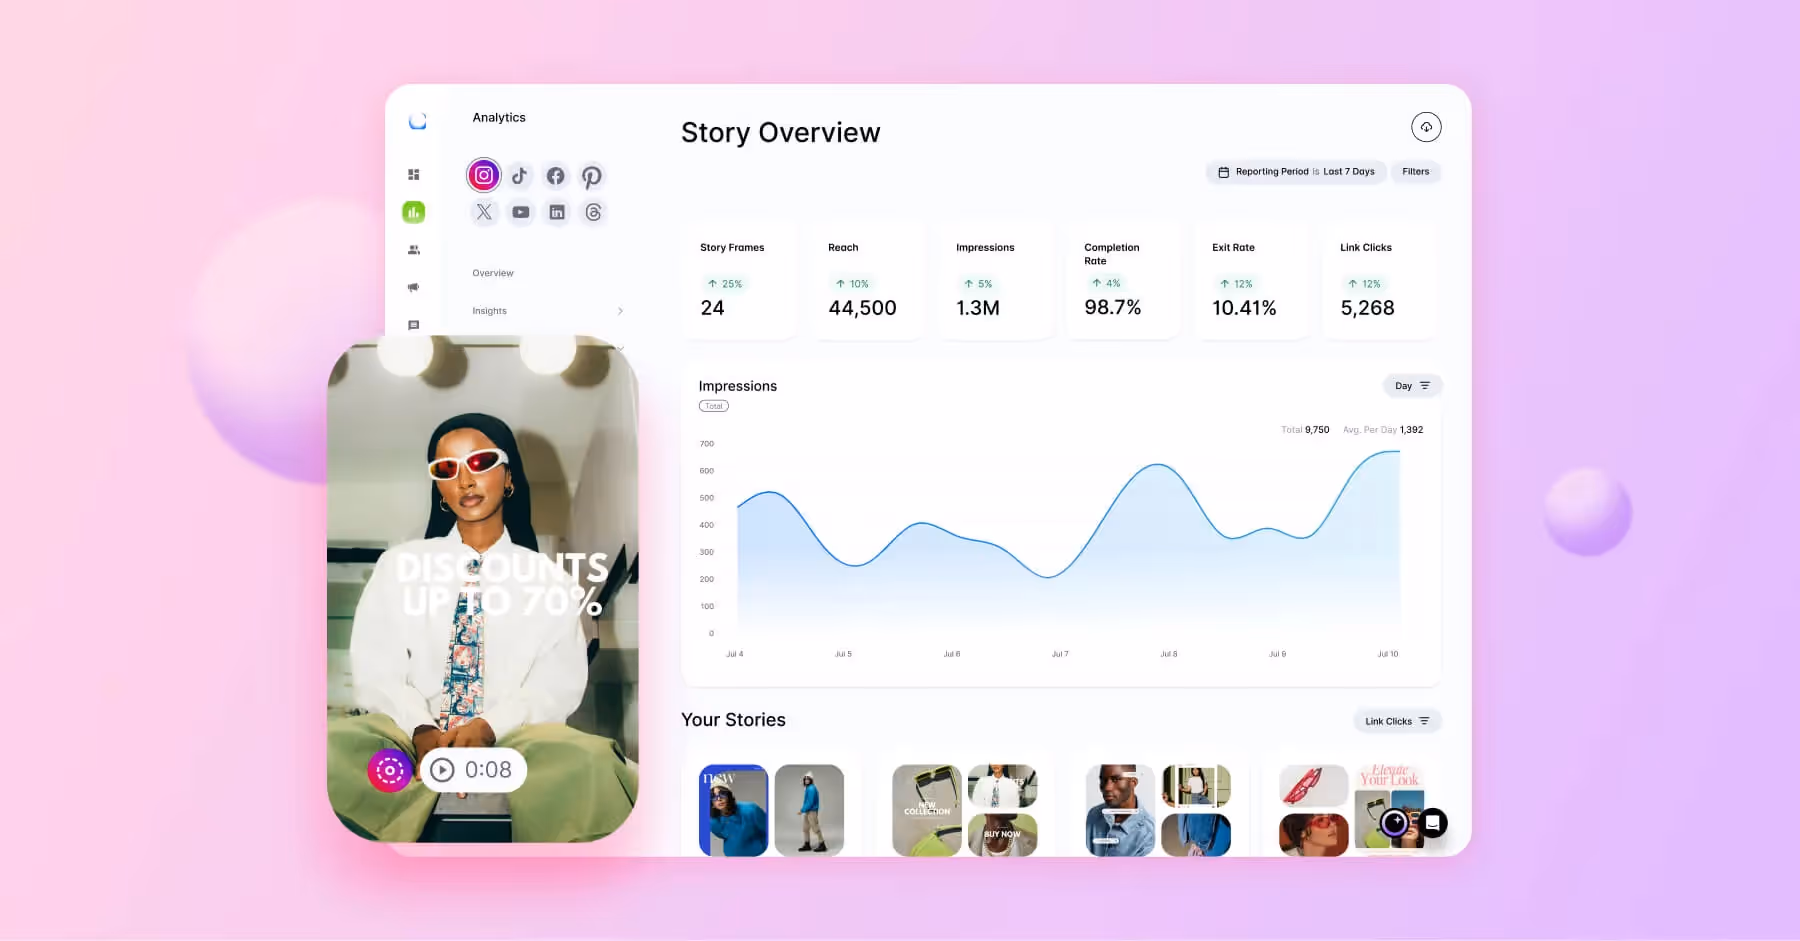
How To Use the Instagram Story Dashboard
The Instagram Story dashboard is where you can see how your Stories are performing within the Instagram app. It gives you a snapshot of recent Story activity, including metrics like reach, views, interactions, link clicks, and navigation actions.
For quick checks, Instagram’s native dashboard is a useful starting point. You can see which Stories reached the most people, which ones encouraged interaction, and where viewers dropped off. This is helpful when you need to answer simple questions like, “Did this Story get seen?” or “Did people tap the link?”
The limitation is that native Instagram Story analytics are not built for deeper brand reporting. They can be difficult to compare across campaigns, time periods, content pillars, or regions, especially if your team needs to report on Stories alongside Reels, posts, influencer content, UGC, or commerce performance.
That’s where a platform like Dash Social becomes more valuable. Dash Social’s Dashboards help brands move beyond one-off Story checks and understand longer-term performance trends, creative patterns, and conversion impact. Instead of only asking how one Story performed, your team can compare Stories by campaign, creative type, product, audience response, and business goal.
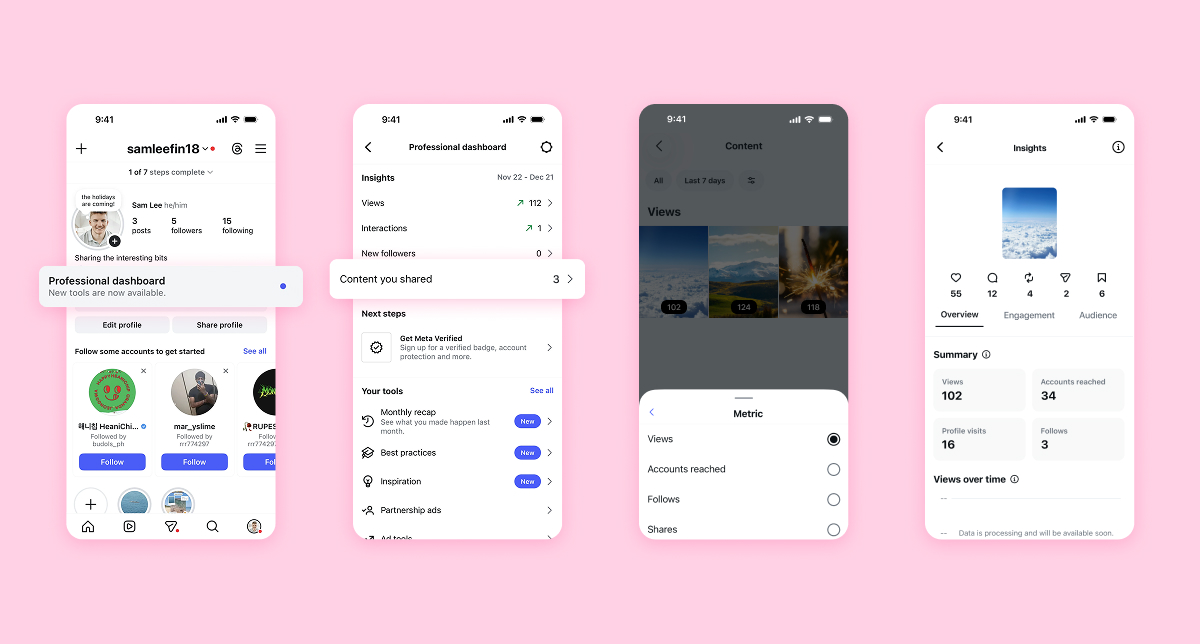
How To View Your Instagram Story Analytics
Now that you know which metrics to track, here’s how to find your Instagram Story analytics in the app.
Note: You need a Creator or Instagram Business account to access Story analytics.
- Open the Instagram app and go to your profile.
- Tap the menu in the top right corner.
- Select Insights or Professional dashboard.
- Go to Content You Shared.
- Select Stories.
- Use filters to adjust the date range or sort by metrics like reach, views, interactions, or link clicks.
- Tap an individual Story to see more detailed performance data.
From this view, you can review your recent Stories in a grid and compare performance by metric. For example, you can sort by reach to see which ones were seen by the most accounts, or by interactions to see which drove the most action.
You can also view insights from an individual live or archived Story. Open the Story, swipe up or tap into the viewer and insights area, then review available metrics like viewers, likes, replies, sticker taps, and link clicks.
Native Instagram analytics are useful for gut checks, but they can be limiting when you need to report over longer time periods, across multiple campaigns, or throughout several content types.
How To Turn Story Insights Into a Reporting Workflow
Instagram Story analytics are most useful when you review them consistently. Instead of checking metrics only when a campaign ends, build a reporting workflow that helps your team make better creative decisions every week, month, and quarter.
For larger teams, a reporting workflow also helps connect Story performance to larger business goals. For example, a product launch Story might be measured by link clicks and website visits, while a community-building Story might be measured by replies, shares, and sticker taps.

Create Beautiful Instagram Stories Every Time
With Dash Social’s Instagram Story Design, make custom templates, fonts and incorporate owned and earned content so you can share engaging UGC, product tags and all of your brand’s best moments in a flash.
Design Instagram StoriesInstagram Story Analytics for Brands vs. Creators
Creators and brands often look at Instagram Story analytics differently.
Creators usually focus on audience growth, community engagement, and content resonance. Metrics like replies, likes, shares, follows, and sticker taps can help creators understand what their audience enjoys and what makes them feel connected.
Brands need those insights too, but they also need to connect Story performance to broader marketing and business goals. For a brand, Instagram Story analytics might help answer questions like:
- Which Stories drove the most qualified website traffic?
- Which product Stories increased interest or revenue?
- Which campaign messages generated the strongest engagement?
- Which creative formats performed best across regions or audiences?
- Which influencer or UGC Stories should be repurposed?
- Which Story sequences had the highest completion rate?
This is why brand teams often need more than just native Instagram analytics.
How To Use Analytics To Improve Your Stories Performance
Having access to Instagram Story analytics is helpful, but the real value comes from knowing what to do with the data. Use the table below to diagnose common performance issues and turn them into practical next steps.
More Tips and Best Practices for Instagram Stories
By applying the strategies above, you’ll be well on your way to improving your Instagram Story performance. But analytics are only one piece of the puzzle. Pairing data with proven Instagram Stories tips can help you create more engaging, accessible, and effective content that keeps viewers watching.
Use these best practices to strengthen your Stories strategy and maximize results.
Stay On Brand
Experimentation is important, but your Stories should still feel connected to your brand. Trends can help boost engagement, but only when they make sense for your audience, tone, and goals. Before jumping on an Instagram trend, ask whether it supports your brand reputation or distracts from it.
Add Captions To Videos
Captions make your Stories more accessible and easier to consume. They help viewers who are watching without sound and make your content more inclusive for people with hearing impairments. If you post video Stories regularly, captions should be part of your workflow.
Create Highlights for Top-Performing Stories
Instagram Stories disappear after 24 hours, but Highlights let you extend the life of your best content. Use Highlights to organize high-value Stories, such as product launches, FAQs, customer stories, influencer collaborations, tutorials, events, and behind-the-scenes content.
Share UGC
User-generated content can be one of the strongest formats for Instagram Stories. It gives your audience social proof, celebrates your community, and helps your brand share more authentic content. Track shares, replies, sticker taps, and link clicks to understand which UGC Stories perform best.
Review Your Analytics Regularly
Instagram Story analytics should be reviewed on a consistent schedule. Weekly check-ins help you make quick creative adjustments, while monthly and quarterly reporting can reveal bigger trends in content performance, audience behavior, and campaign impact.
Top 3 Instagram Story Analytics Tools for Advanced Insights
As we’ve already covered, native Instagram analytics are helpful for a quick snapshot, but they can be limiting when brands need richer insights into content performance, audience behavior, and conversions.
The right Instagram Story analytics tool should help you compare performance over time, understand which content drives action, and turn insights into better creative decisions.
1. Dash Social
Dash Social gives brands a more complete way to understand Instagram Story performance.
REVOLVE faced this exact challenge. As an early adopter of Instagram Stories, the fashion retailer was publishing Stories regularly but lacked the data needed to understand how audiences were responding. Using Dash Social's Instagram Stories Insights, the team gained access to historical Story performance data, identified engagement patterns, benchmarked content, and applied learnings to future campaigns.
"We had no idea if our Stories content was engaging our followers. With Stories Insights, we're actually able to gather data! It's so helpful to be able to look back at older Stories for reference and learnings." — Anna Tran, Brand Director at REVOLVE
Read the REVOLVE Instagram Stories case study.

2. Sprout Social
Sprout Social helps brands monitor Instagram Story performance alongside analytics from other social platforms. Teams can track metrics like reach, views and engagement, build custom reports, and analyze performance across selected date ranges.
For organizations looking for a broad social media management and reporting solution, Sprout Social provides a centralized view of social performance across multiple channels.
Compare Sprout Social vs. Dash Social

3. Hootsuite
Hootsuite combines analytics with Instagram Stories scheduling and social media management tools. Brands can monitor metrics such as replies, exits, taps back, and taps forward to better understand how audiences interact with Story content.
For teams that prioritize content planning, publishing, and cross-platform management, Hootsuite offers a way to manage Instagram Stories alongside broader social media activities.
Compare Hootsuite vs. Dash Social

Instagram Stories are at their best when they combine creativity with clear performance insights. The more consistently you review your analytics, the easier it becomes to understand what your audience wants, where they lose interest, and which content drives meaningful action.
Start with the basics: reach, views, navigation, interactions, and link clicks. Then look deeper at completion rate, exit rate, sentiment, campaign performance, and website activity. Over time, these insights can help your team create purpose-driven stories, build a more engaged audience, and connect social performance to real business outcomes.
Instagram Story Analytics FAQs
Can you see analytics on Instagram Stories?
Yes. You can see Instagram Story analytics in the Instagram app if you have a Creator or Business account. Native Instagram Insights can show metrics like reach, views, interactions, link clicks, and navigation actions.
Can I see who viewed my Instagram Story?
Yes. You can see who viewed your Instagram Story while the Story is live and, in some cases, from your archive. Open your Story and tap the viewer list or eye icon to see who viewed it. It’s important to note that Instagram does not currently show how many times each individual person viewed your Story.
Do you need a special account type to access Instagram Story analytics?
Yes. You need a Creator or Instagram Business account to access Instagram Story analytics. Personal accounts can see basic viewer information, but they don’t get the same level of performance data available in Instagram Insights.
What are the main categories of Instagram Story metrics?
The main categories are navigational metrics, discovery metrics, and engagement metrics. Navigational metrics show how people move through your Stories. Discovery metrics show how many people found or viewed your content. Engagement metrics show what actions people took, such as replies, shares, sticker taps, and link clicks.
How can you reduce a high exit rate on Instagram Stories?
To reduce a high exit rate, make your first frame stronger, shorten long Story sequences, and move your most important message or CTA earlier. You should also review the exact frame where exits spike. If people leave at the same point repeatedly, that frame may be too text-heavy, unclear, repetitive, or disconnected from the rest of the sequence.
How often should you review your Instagram Story analytics?
Review Instagram Story analytics weekly for quick creative optimizations and monthly for broader performance trends. For campaigns, review Story analytics during the campaign and after it ends so you can understand reach, completion rate, exits, link clicks, and conversions in real time.