Ultimate Guide to Social Media Reporting in 2026 (4 Free Templates)
If brands have learned anything by 2026, it’s that social media is critical to their survival and growth, and social media reporting is one of the most important pieces of the puzzle.
Contents
What Is a Social Media Report?What Is Social Media Reporting?Why Does Social Media Reporting Matter?What Should Be Included in a Social Media Report?How To Get Started With Social Media Reporting in 5 StepsSocial Media Reporting Types and Expert ExamplesFree Social Media Report TemplatesSocial Media Reporting TipsTurning Social Media Reporting Data Into ActionSocial Media Reporting FAQs
Sometimes, it can be tricky for a social media manager to get traction on creative campaigns or financial support from top decision-makers. That’s when creating a social media report can become your greatest asset. With the right content, structure, and social media data, you can explore everything from channel value and ROI to strategy and project planning with key stakeholders who make everything happen.
Key Takeaways:
- Social media reporting turns raw data into clear insights that help secure buy-in from decision makers.
- Reports should focus on the metrics and goals that matter most rather than tracking every available data point.
- Different report types, such as campaign, competitive, platform, time-based, and custom, serve unique strategic needs.
- Free templates like KPI, audit, and competitive analysis reports make it easier to start tracking performance effectively.
- Turning report insights into action ensures strategies evolve based on what works and what needs improvement.
What Is a Social Media Report?
A social media report is a summary of how your social channels performed over a set period of time. These types of reports usually highlight key metrics, progress towards goals, and top-performing content, all while providing both a high-level overview and platform-specific insights. Social media reports are often shared with teams and stakeholders to better inform strategy and decision-making.

What Is Social Media Reporting?
Broadly, social media reporting is the act of monitoring and sharing data and other relevant results from your social media accounts and campaigns. Effective social media reporting gets granular. Brands should look at results specific to campaigns, larger marketing or sales objectives and particular account metrics.
With this in mind, brands might choose to do many forms of social media reporting based on their goals and who they share data with. For example, is your brand trying to reach a new demographic on social? Use social listening to monitor and report on brand or product mentions from this group to learn more about how your brand is perceived.
Why Does Social Media Reporting Matter?
Social media reporting is fundamental to understanding what works in your strategy, where you need to adjust, and which content resonates most with your audience.
For instance, if a brand consistently creates a particular style of visual content but sees little to no growth in impressions or engagement, a social media report can reveal where users lose interest and disengage. Additionally, these reports provide data-driven insights that help justify strategic pivots, making it easier to communicate the need for a new visual approach to the wider team.
What Should Be Included in a Social Media Report?
What to include in a social media report depends directly on your brand goals and broader strategy. While it may feel beneficial to report on every single metric, that can often muddy the actual results you’re measuring your success against.
That being said, there are a few cornerstone insights you’ll want to include, such as:
- Likes, shares, and comments.
- Engagement rate and impressions.
- Number of posts.
- Video views.
- Top performing content.
- Creator performance.
- Follower growth.
- Clicks to website/website traffic.
- Action items.
Remember not to overfill your report with data and content. Let the numbers speak for themselves and add verbal context where you can when presenting.
How To Get Started With Social Media Reporting in 5 Steps
1. Determine Your Audience
Like any good social media campaign, your report needs to focus on your target audience. A finely tuned social strategy can’t always reach everyone. First, consider who will read the report or to whom you’ll present it. This should inform the data points you include, the style and structure of your document, and the cadence of your social media reporting schedule.
Suppose you want to share the report with your creative team. You’ll likely want to include stats about campaigns, get granular on individual post performance, and share actionable insights frequently. If you report to senior management, you should focus on high-level metrics like ROI and how they relate to the company’s bottom line.
2. Consider Your Goals
Not every marketer uses social media in the same way. Product-based businesses almost exclusively tap into selling potential, while those focused on services tend to prioritize awareness. This could mean honing in on stats for engagement, web traffic, and click-through rate (CTR) to emphasize value for sales or organic reach, or effectiveness and growth rate to prove the power of your creative.
Depending on your social media reporting cadence, you might want to zoom in on goals for individual campaigns and channels or generally speak to how results from every social channel align with and support overall brand goals.
3. Set Your Cadence
How often you create a social media report depends on your position and the outcome of steps one and two. As a general best practice, social media professionals should share reports within the team on a weekly or monthly basis to understand how their efforts are paying off and adjust the social marketing strategy accordingly.
At the senior level, sharing reports once per quarter should suffice. It can also be beneficial to report on the progress of individual campaigns, particularly if an aspect of a campaign is different from your usual content or schedule.
4. Source Your Data
Every social channel has its own version of native analytics, including Instagram, Facebook, Pinterest, YouTube, X, and TikTok. Alternatively, if you need more robust reporting insights or a longer data retention window, several social media analytics tools and influencer analytics tools can save you time and aggregate important information for you. Dash Social's Instagram and Pinterest Insights, for example, give you a complete snapshot of your stats with an easy-to-download CSV or PDF. You can filter, sort, and dig deep into the numbers for a perfectly organized, accurate report.
5. Action Items
Once you gather your data, you’ll have a better picture of what direction to take your strategy. You should outline this in your social media report accordingly. Be as thorough as possible so your audience has proper expectations for what will occur between now and your next report. What successes will you build on, and what will you change to reach your goals?
Include recommendations, dates, and timelines whenever possible. Your reporting efforts are all about providing evidence to those who need it that your work is important, effective, and valuable.
Social Media Reporting Types and Expert Examples
There are many different types of social media reports that brands can utilize to share data with their team and stakeholders. Here are some examples of the most commonly used reporting formats, with examples from the Dash Social platform.
Competitive Reports
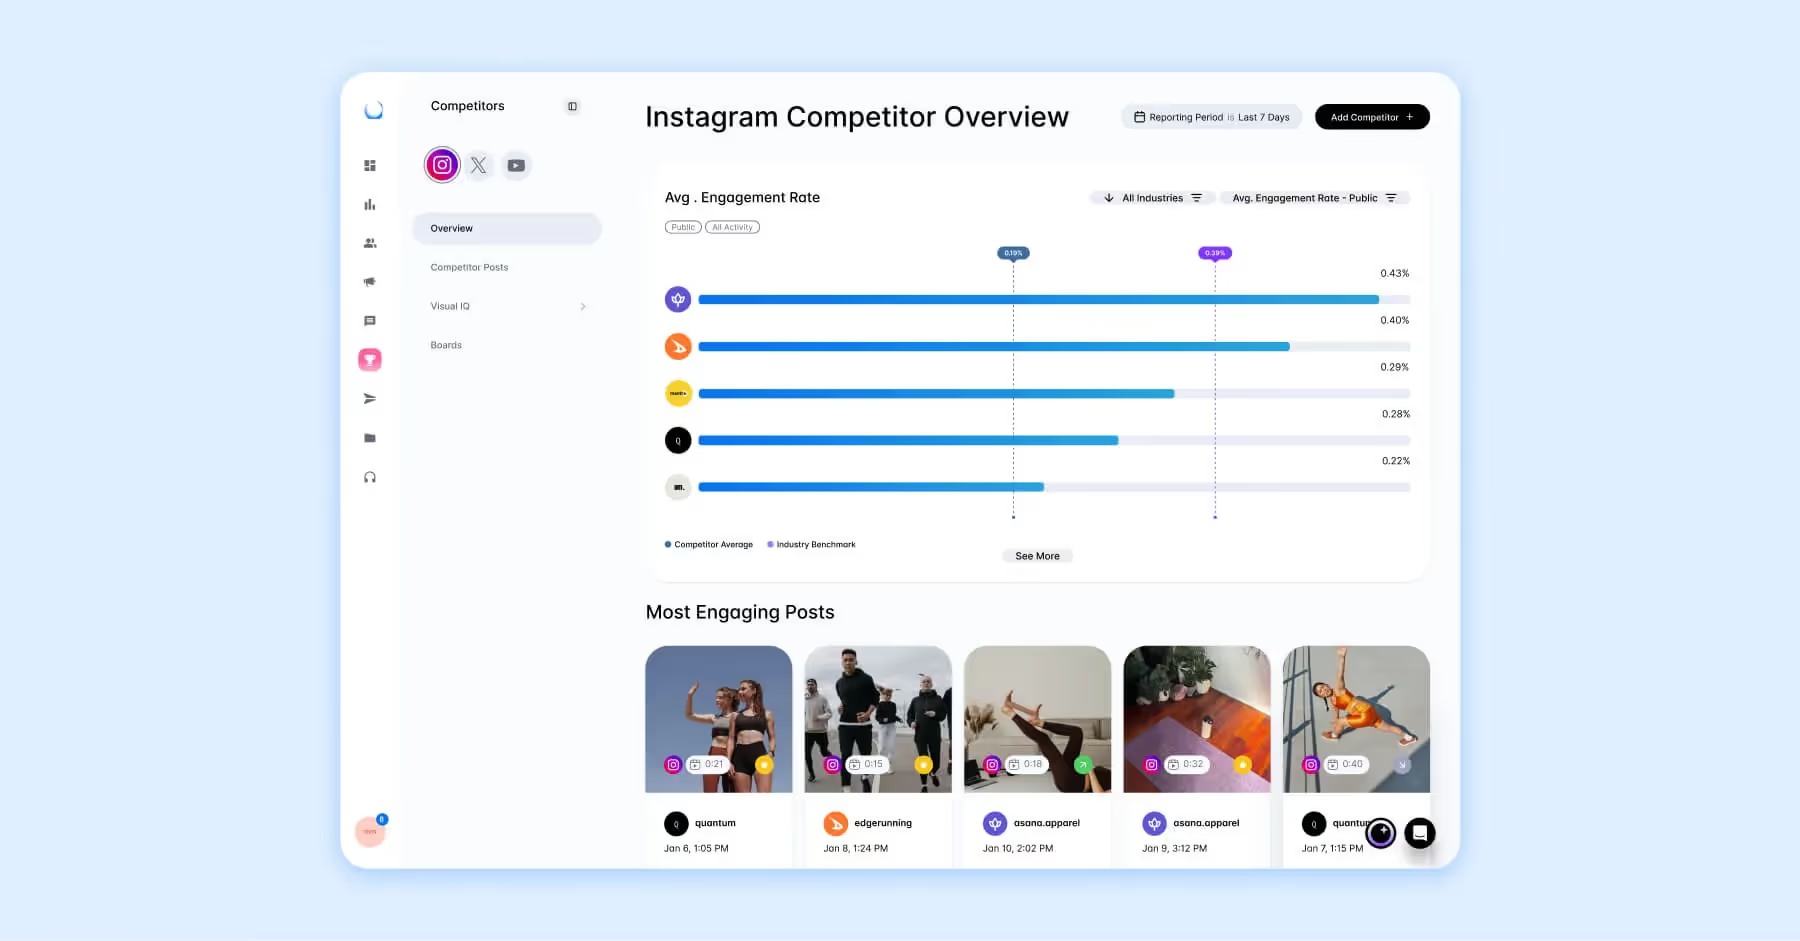
Competitive reports are essential for competitive benchmarking, helping you evaluate new initiatives against industry rivals. Regularly pulling these reports with competitor analysis tools keeps you informed on competitor strategies, market trends, and shifts in key performance metrics, ensuring you stay ahead of industry peers.
Campaign Reports
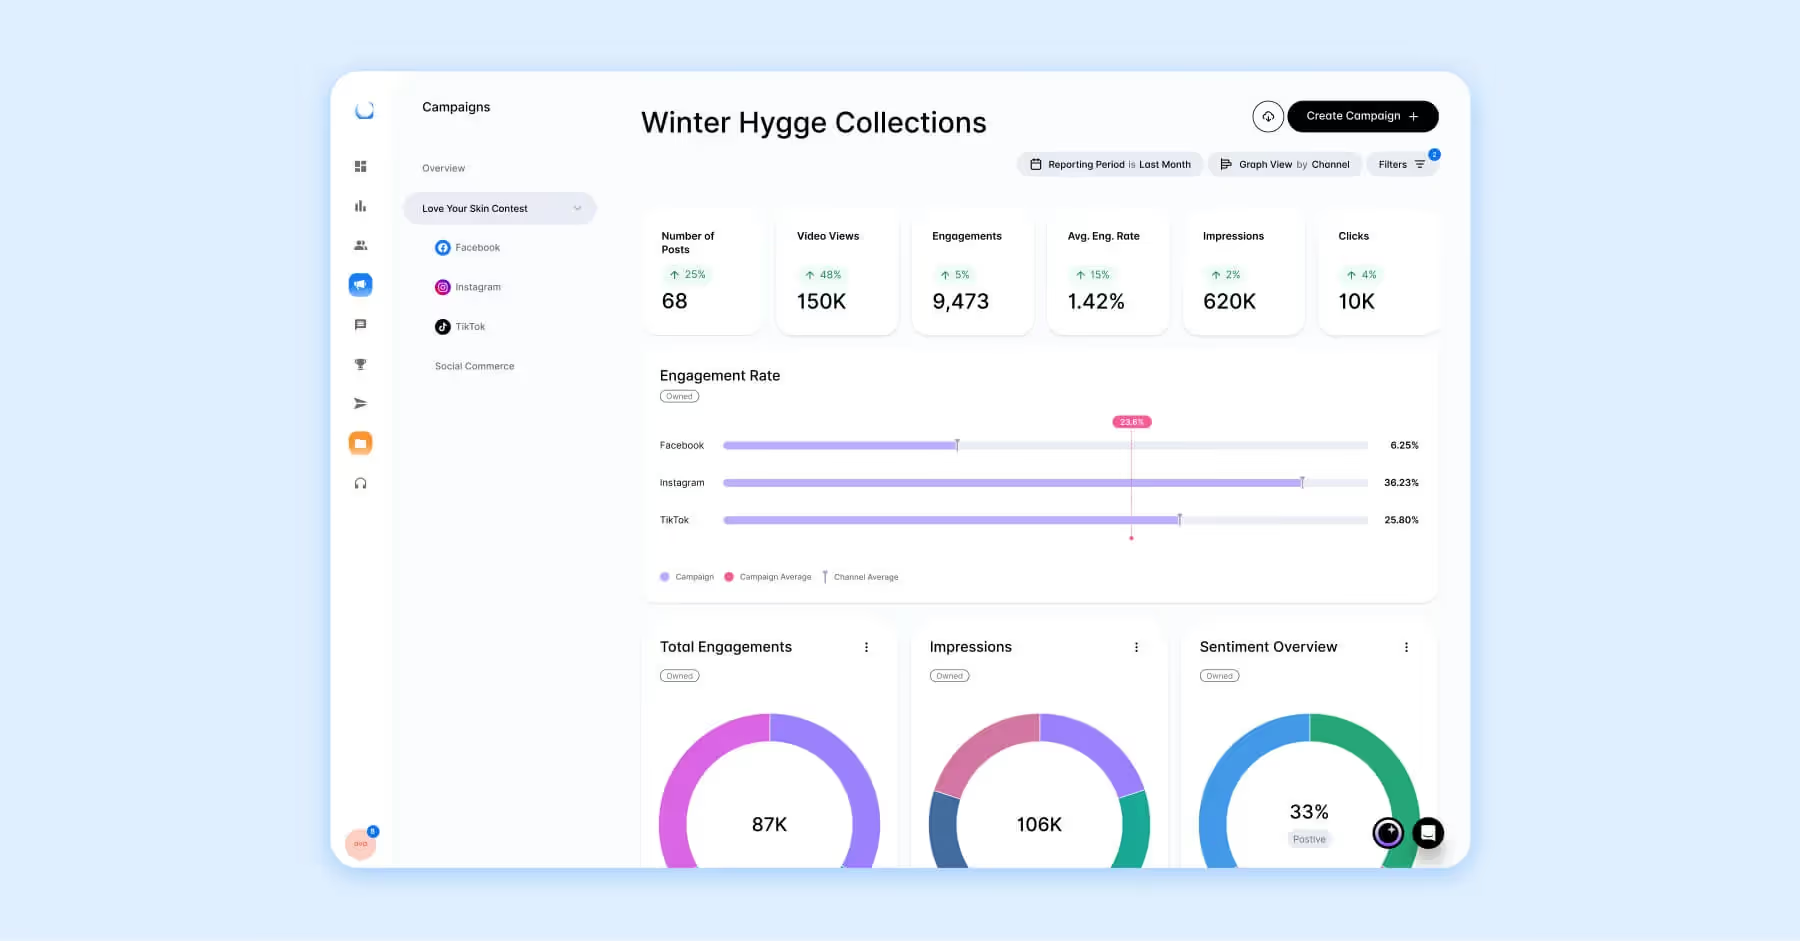
A campaign report is one of the most popular report types. It allows you to track and report on the performance of a specific campaign. This can be done cross-channel and can give a holistic view of how your campaign performed, what to incorporate into future campaigns, and what you might want to skip next time.
Individual Channel Reports
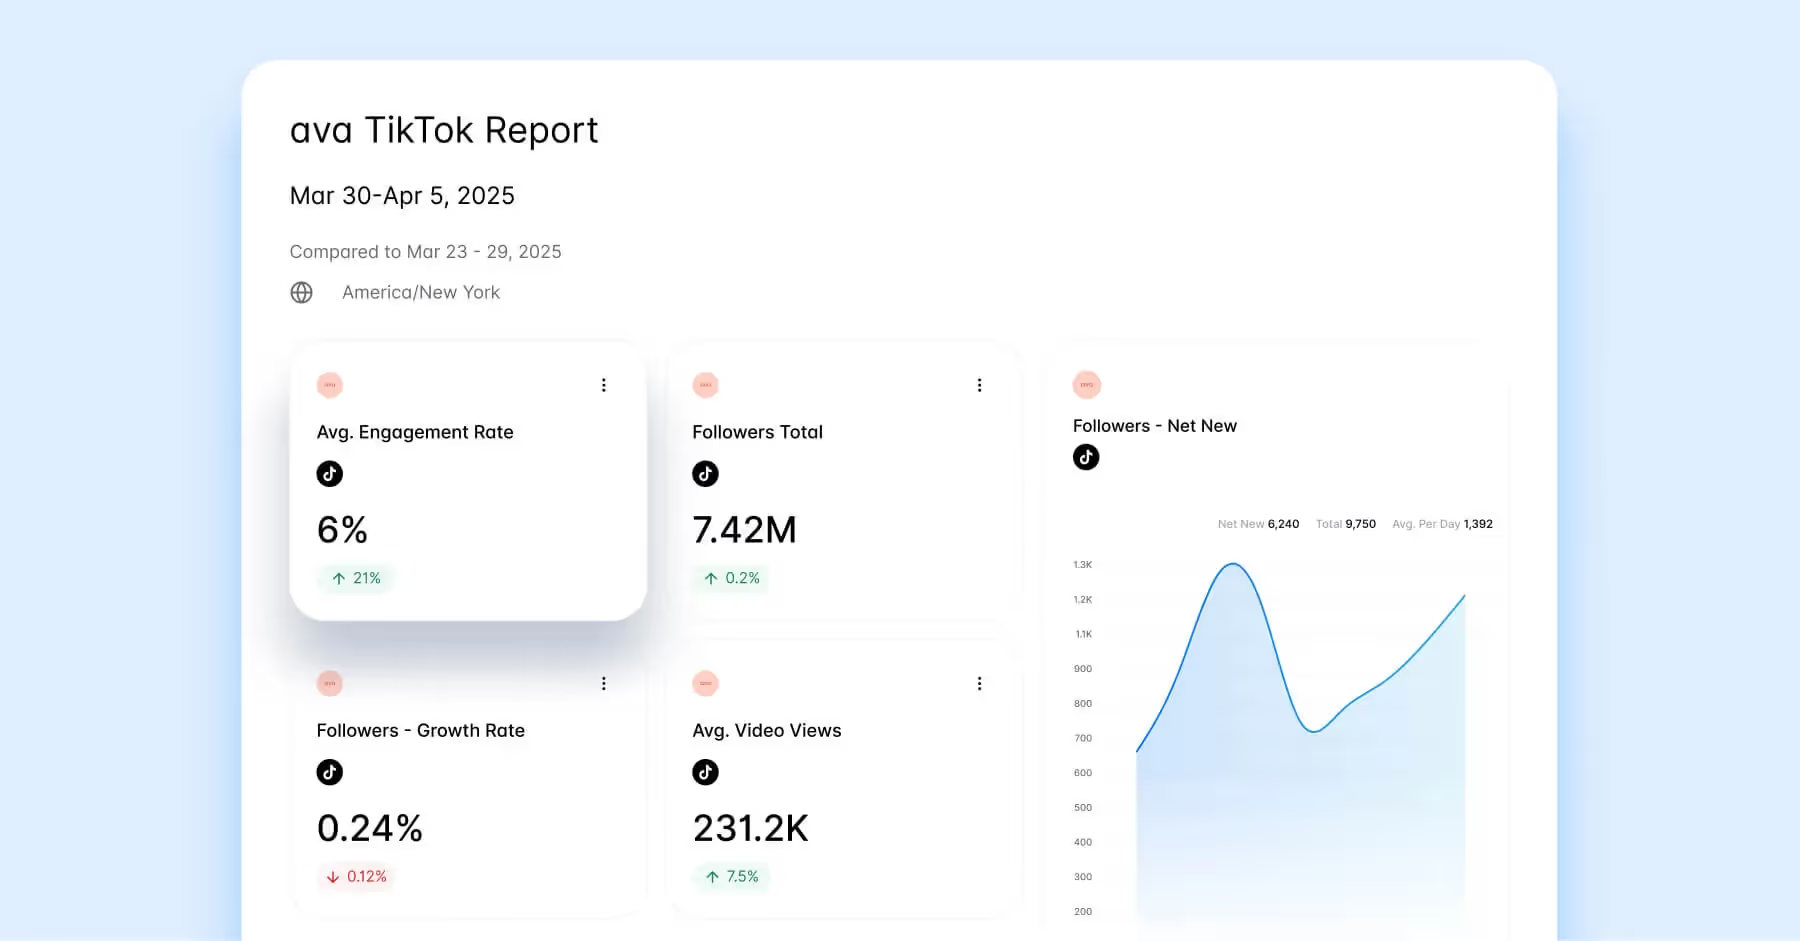
Social channel reports are used when pulling data and results for a specific platform. Your team may be curious about how your TikTok marketing strategy is performing, so you can use a platform report to break down every detail of that strategy and how it's working. Bonus points if you add general platform trends to help contextualize your results.
Time-Based Reports
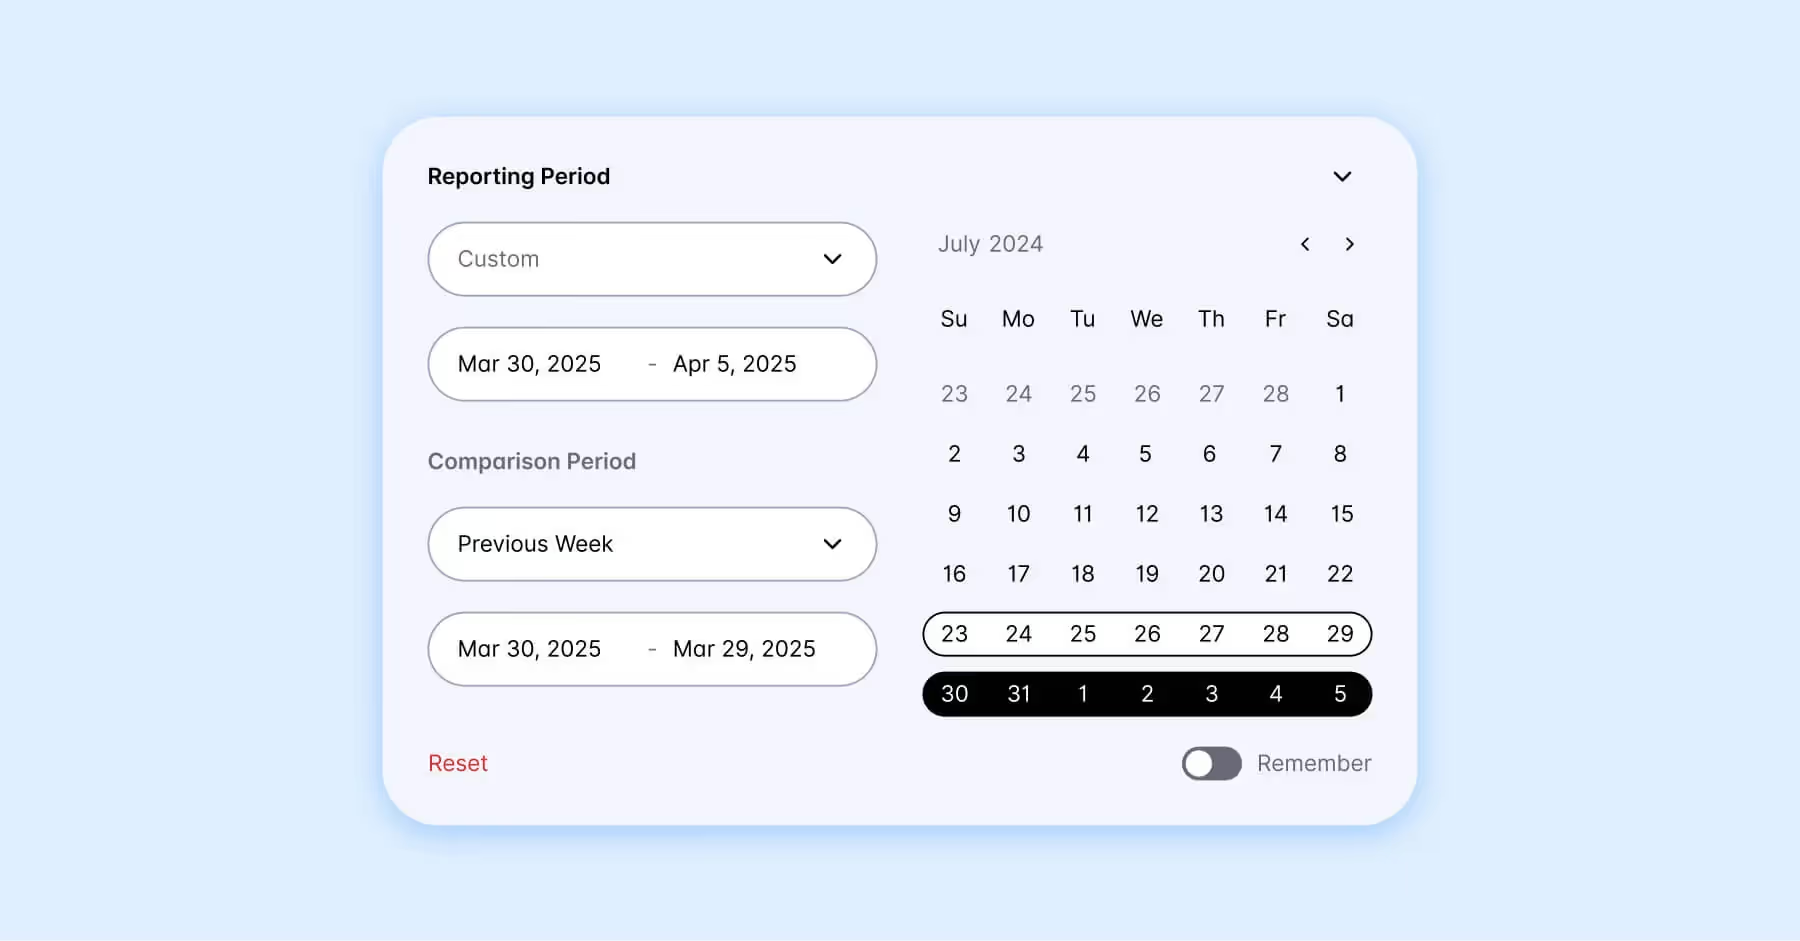
Time-based reports are simple. They are periodic reports you find yourself pulling daily, weekly, monthly, quarterly, or yearly. You typically track the same metrics so you can directly compare your current report performance to your last, allowing you to speak directly to your results based on a specific period of time.
Custom Reports
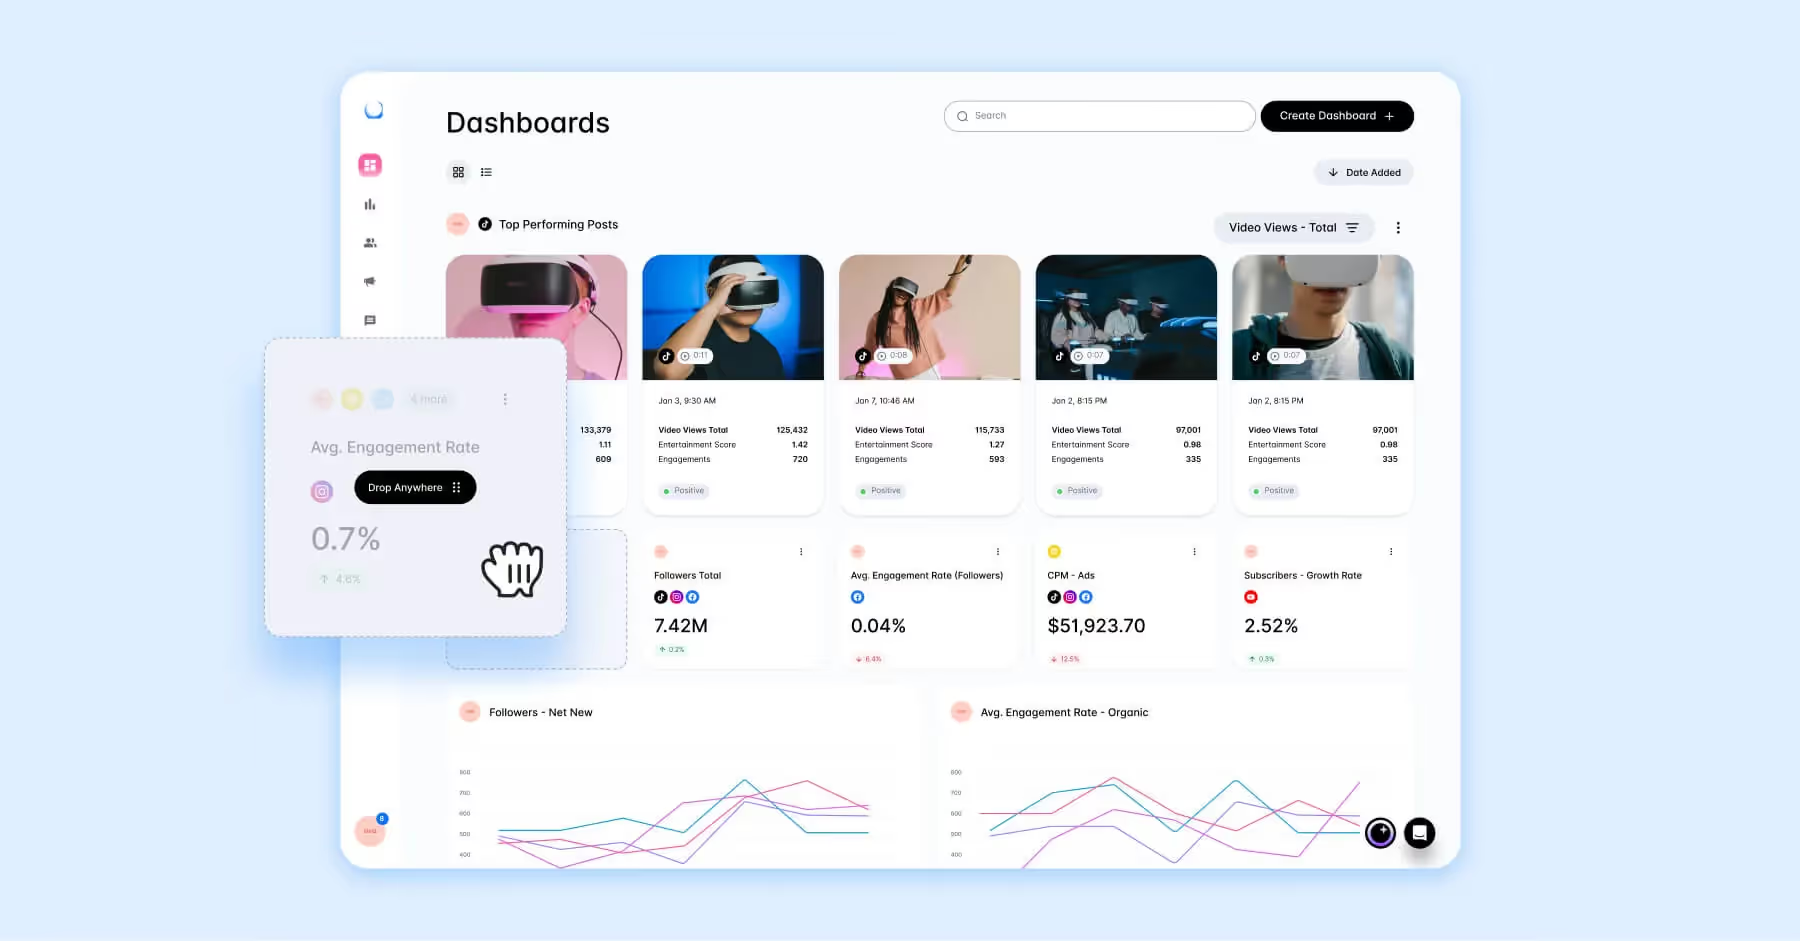
A custom report can become a mix and match of all of the report types above and more. Sometimes the data you’re looking for doesn’t fit into a specific box, and that’s where a custom report comes in. They can be built from scratch to cover exactly what’s needed. While they may take more time to create upfront, the data they provide is incredibly valuable.
Free Social Media Report Templates
Creating a social media report from scratch can feel daunting. That’s why the team at Dash Social offers a collection of free, ready-to-use report templates, so brands can download and start analyzing their performance right away. Here are four free templates that are available to use right now.
Social Media Report Template
A general social media report is a necessity in any social media manager's toolkit. This free report template deck lets brands track monthly and quarterly performance broken down by channel, top-performing content, creator performance, key learnings, and even actions to inform the next steps.
Download Your Free Social Media Report Template
Social Media KPI Report Template
Understanding (and being able to report on) your KPI performance is crucial for brands that want to see results. This template can be used to decide on the perfect KPIs for any given campaign or strategy and, of course, report on the performance broken down by channel and social media KPI categories like engagement, content, growth, and more.
Download Your Free Social Media KPI Report Template
Competitive Analysis Report Template
A competitive analysis report is one of the most useful, actionable reports a brand can create. With this comprehensive competitive analysis template, brands can analyze keyword performance, general competitive landscape, and social performance, plus the opportunity to provide recommendations and next steps.
Download Your Competitive Analysis Report Template
Social Media Audit Report Template
Sometimes, brands need to create a broad report on account health and performance. This is where an audit template becomes useful. It provides a clear and structured way to track key metrics like follower count, engagement rate, and top-performing content across all major social channels, making it easier to communicate overall performance.
Social Media Reporting Tips
Every single social media report you create is full of nuance and context. Because of this, each report you create is unique, making it hard to nail down the “right way” to do it. Below, we outline some guidelines that can help if you’re starting a report from scratch or have an existing report that could use some help.
Choose the right report type
Choosing the right type of social media report ensures you’re focusing on the metrics and insights that actually align with your goals. Different reports serve different purposes, and depending on the audience of yours, there will be specific levels of detail that are needed (or not). Without the right format for your report, important results can get lost or misinterpreted.
Report on relevant metrics only
Focusing on only relevant metrics allows your report to clearly reflect progress towards your specific goals, rather than being diluted by vanity metrics or metrics that don’t impact the direct results. By reporting on specific metrics, stakeholders can quickly understand what’s working, what’s not, and where action needs to be taken. Prioritizing the right data also makes your reporting more efficient and easier to act on.
Remember, less is more
Keeping reports concise makes it easier for team members to quickly grasp performance and key takeaways without getting lost in unnecessary detail. Rather than creating a report overloaded with data, focus on only the most important results in order to create messaging that is clear, actionable, and connects back to goals.
Create an executive summary
An executive summary distills your report into the most important points, making it simple for anyone to quickly understand performance, without needing an entire history lesson on results. A thorough summary leaves no stone unturned while highlighting key wins, challenges, and next steps. This is often the most critical part of a report for high-level and executive team members.
Turning Social Media Reporting Data Into Action
To be frank, social media reporting can make or break your brand's success on social.
Be sure to harness the data you gather by summarizing the most important takeaways. You have all this data, but what does it actually mean? Demonstrate your understanding of the results, including what you learned, why you feel the final outcome occurred (whether or not it was positive or negative), and what you need from your team, from budget increases to project deliverables.
Remember those weekly and monthly reports we mentioned earlier? Dash Social lets you create custom Dashboards that pull in all the data you need and none of the data you don’t.
Benchmarks are another asset to any social media report. Competitive Insights and Benchmarking let you compare your success and data to your competitors, so you can refine your goal and see how your brand stacks up in your industry.
Social Media Reporting FAQs
How do you create a social media report?
Creating a social media report can take many forms, but the basic building blocks are the same.
- Define your goals: what do you want to achieve with your efforts?
- Identify the metrics that matter to you: which social media KPIs will best represent your efforts?
- Collect your data: are the metrics from native platforms good enough for your data needs, including historical trends, or will you require third-party reporting tools for deeper insights?
- Review your data and present results: this is where you learn what’s working and what’s not. What can you learn from this data, and how can you best present it to your audience?
What KPIs do you use in social media reporting?
The KPIs you decide to monitor will depend on your goals and strategy. For instance, if your focus is on increasing brand awareness, you might prioritize metrics like follower growth and positive sentiment analysis from social listening reports.
However, some key KPIs that most social marketers track to measure and report on campaign success include engagement rate, impressions, reach, follower retention and growth, and conversion rate.
How do you create a social media report for executives?
When creating a social media report for executives, focus on high-level metrics that tie directly to business goals, such as reach, engagement, conversions, and ROI, while also highlighting key wins, trends, and actionable insights. Keep your report as concise, visual, and insight-driven as possible so executives can quickly understand performance and make strategic decisions based on the results.
Which social media metrics matter the most in reporting?
The most important social media metrics when it comes to reporting are those that are tied directly to your goals. When reporting on success, it’s much more important to focus on metrics that show impact on business outcomes like engagement or ROI, instead of surface-level activity like likes or follower count.
What tools help automate social media reporting?
Tools like Dash Social help automate social media reporting by pulling data into centralized dashboards and generating ready-to-share reports. Many social media reporting platforms also offer customizable, AI-powered insights and automated reporting scheduling to save time and improve accuracy.
How often should you create a social media report?
Social media reports are typically created monthly to track performance and progress over time, though weekly reports can be useful for newer or more active campaigns. The right cadence is entirely dependent on your goals, reporting needs, and how quickly you need to act on the insights from the report.