The Effectiveness Rate of Photo vs Video on Social Media
Understand your content's full impact with Effectiveness Rate.
Contents
Engagement rate has become a north star metric for many brands, but it doesn’t always capture the full picture. If you analyze performance only from an engagement perspective, it might appear that the content underperformed, even when it didn’t.
Leading brands like CB2 use Effectiveness Rates alongside engagement metrics in their social media reporting to gain an informed and complete view of content performance and incorporate that learning into their future social media strategies.
Key Takeaways:
- Effectiveness Rate shows how well content performs with your actual audience by measuring total interactions against reach.
- Combine the Effectiveness Rate with engagement and Entertainment Score for a full view of content success.
- Aim to hit the general performance range between 3-5% for photos and carousels and 2-4% for videos, with some fluctuation depending on your specific industry.
What Is Effectiveness Rate and How Do You Calculate It?
Effectiveness Rate is a metric that helps contextualize true engagement and reach. It hits the measurement sweet spot for brands that value every interaction with their content and want hard data to see what inspires that action. It is calculated as:
Effectiveness Rate = (Engagements) / Reach
By utilizing engagements and reach, brands can understand how content performs without skewed numbers due to a high follower count and lower reach. It is important to consider these metrics holistically and the shift from social media to social entertainment. Effectiveness Rate even illuminates your posts that only a few people see. By including reach, brands can understand if the content resonates with those who can see it.

How Dash Social Measures Engagement Rate
Ultimately, Engagement Rates measure how much your audience interacts with, is involved with, and is devoted to your content. Dash Social measures Engagement Rate by either views or impressions, with some variation between platform and content type (Meta, for example, measures engagement rate by views, and doesn’t include impressions in its calculations). Here’s how Dash Social calculates engagement rate:
Engagement Rate = Engagements / (Views or Impressions)
These two methods of measuring engagement are relevant given the shift in social media to algorithmic feeds. Calculating engagements by impressions or views over reach helps you measure how your content resonates with everyone who’s interacted with it, including repeat visitors.
How Do You Measure the Success of a Video?
Video has seen impressive growth on social, with both watch time and views increasing across TikTok and Instagram, and more social media platforms prioritizing short-form video formats.
Historically, video has been a challenging content format to measure accurately. Audiences engage with video differently than with static content, so it’s important to monitor and measure the right metrics to see what’s working and where opportunities lie.
This is why Effectiveness Rate is an excellent indicator of video success. When combined with Entertainment Score, brands get a robust picture that shows precisely how impactful their creative content is. Entertainment Score measures your engagement and retention rates so marketers can go beyond momentary performance and into long-term trends, patterns, and wins. They can also see how it contributes to overall audience engagement, follower retention, and growth.
Think of Effectiveness Rate as a measurement of the quality of your engagements, engagement rate as a measurement based on who’s viewing content, and Entertainment Score as a measure of how well your creative lands with audiences and keeps them watching.
Effectiveness Rate Benchmarks Across Industries
When benchmarking your performance, context matters. Understanding how your brand compares to industry benchmarks helps teams set realistic goals and evaluate results more accurately. We looked at the average Effectiveness Rate for each month during Q4 of 2025 to identify industry trends for photo and video performance.
The Effectiveness Rate benchmarks below can inform both goal setting and performance analysis. A quarter-over-quarter drop doesn’t automatically signal a problem if your industry saw a larger decline. Similarly, gains are most impactful when they surpass industry averages. Reviewing how effective your creative assets are with this context helps teams adjust their tactics, refine their creative, and make more confident decisions each quarter.
Industry Effectiveness Rates: Photos and Carousels
Industry Effectiveness Rates: Video and Reels
Overall Industry-Wide Effectiveness Rate
Here’s how photo and video performed overall in terms of Effectiveness Rate in Q4 2025:
- Average Q4 2025 Photo and Carousel Effectiveness Rate: 4.4% (0%)
- Average Q4 2025 Video Effectiveness Rate: 3.8% (-3%)
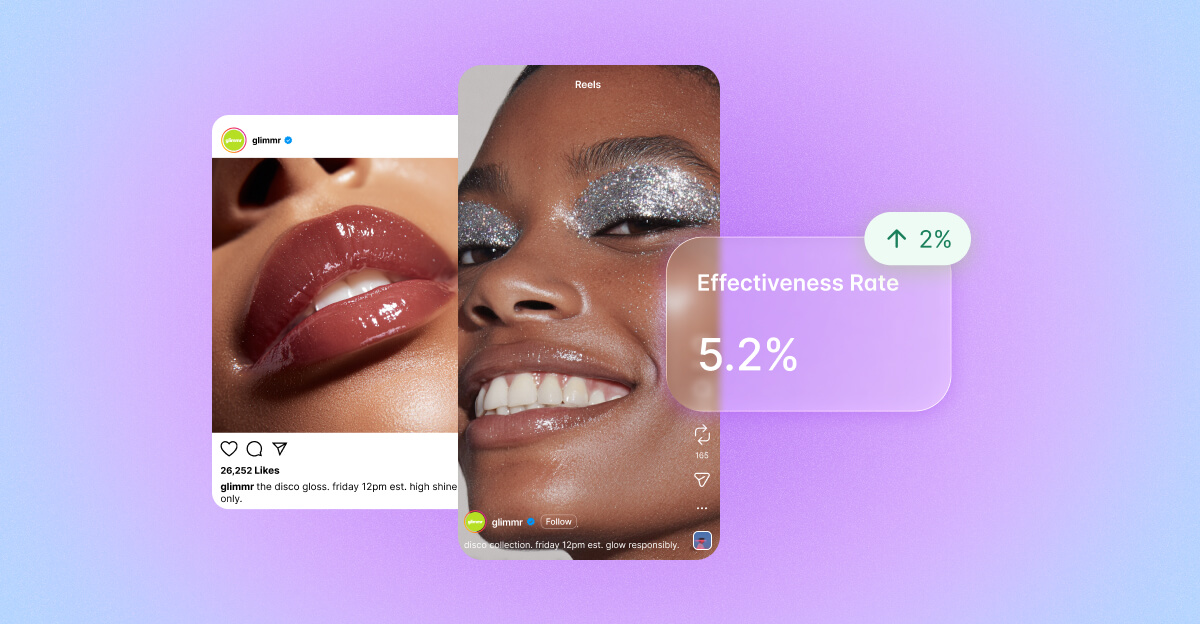
Beauty Industry Effectiveness Rate
Beauty maintained its position as a strong performer, with photo and carousel effectiveness rising 2% to 5.2%, and video maintaining its score at 4.2%. Here’s how photo and video performance shifted across the beauty industry this quarter:
- Average Q4 2025 Photo and Carousel Effectiveness Rate: 5.2% (+2%)
- Average Q4 2025 Video Effectiveness Rate: 4.2% (0%)
CPG Industry Effectiveness Rate
CPG saw one of the largest shifts quarter over quarter, with photo and carousel Effectiveness Rate growing 12% to 5.7%, while its video score decreased 4%, indicating some renewed momentum for static formats in this industry. Here’s a breakdown of the performance changes in photo and video Effectiveness Rate for the CPG industry this quarter:
- Average Q4 2025 Photo and Carousel Effectiveness Rate: 5.7% (+12%)
- Average Q4 2025 Video and Reels Effectiveness Rate: 4.5% (-4%)
Retail Industry Effectiveness Rate
The retail industry continues to perform strongly, seeing flat or conservative increases in photo and carousel effectiveness, while video either declined or stayed unchanged. Below is the quarterly change in photo and video Effectiveness Rate for the retail industry:
- Average Q4 2025 Photo and Carousel Effectiveness Rate: 3.2% (0%)
- Average Q4 2025 Video Effectiveness Rate: 2.9% (-6%)
Fashion Industry Effectiveness Rate
Fashion has also continued to perform well, with minor increases in photo and carousel effectiveness, while video stayed unchanged. These results reflect ongoing saturation and competition, underscoring the need for sharper creative testing and more selective video investments. This quarter, photo and video Effectiveness Rate in the fashion industry saw the following changes:
- Average Q4 2025 Photo and Carousel Effectiveness Rate: 3.3% (+3%)
- Average Q4 2025 Video Effectiveness Rate: 2.8% (0%)
Luxury Industry Effectiveness Rate
Luxury industries also experienced significant gains. Photos and carousel average Effectiveness Rate grew to 4.7% for a 9% increase, while video Effectiveness for luxury brands grew 16% to 4.3%, making it one of the greatest quarter-over-quarter improvements across industries. The following outlines shifts in photo and video Effectiveness Rate for the luxury industry this quarter:
- Average Q4 2025 Photo and Carousel Effectiveness Rate: 4.7% (+9%)
- Average Q4 2025 Video Effectiveness Rate: 4.3% (+16%)
Media Industry Effectiveness Rate
Interestingly, the media industry shows balanced performance across photo and carousel Effectiveness Rates quarter over quarter. Meanwhile, video and Reels saw moderate growth. Below is a breakdown of the performance changes in photo and video Effectiveness Rate for the media industry this quarter:
- Average Q4 2025 Photo and Carousel Effectiveness Rate: 4.0% (0%)
- Average Q4 2025 Video Effectiveness Rate: 4.3% (+2%)
Publishing Industry Effectiveness Rate
Publishing industry brands demonstrated balanced improvement across both formats this quarter, with steady growth in both static and video content. This quarter brought the following changes to photo and video Effectiveness Rate within the Publishing industry:
- Average Q4 2025 Photo and Carousel Effectiveness Rate: 4.0% (+5%)
- Average Q4 2025 Video Effectiveness Rate: 3.9% (+5%)
Home Industry Effectiveness Rate
Home brands experienced steady performance in static content this quarter, with photo and carousel Effectiveness Rate holding flat at 4.0%. However, video saw a slight decline, decreasing 3% to an average Effectiveness Rate of 3.2%, suggesting softer engagement across motion-based formats.
- Average Q4 2025 Photo and Carousel Effectiveness Rate: 4.0% (0%)
- Average Q4 2025 Video Effectiveness Rate: 3.2% (-3%)
Food and Beverage Industry Effectiveness Rate
The food and beverage industry continued to stand out as a strong driver of engagement compared to other industries. Video Effectiveness Rare rose to 4.7%, even as photo performance dipped slightly. Below is a breakdown of how photo and video Effectiveness Rate shifted within the industry this quarter:
- Average Q4 2025 Photo and Carousel Effectiveness Rate: 5.4% (-5%)
- Average Q4 2025 Video Effectiveness Rate: 4.7% (+2%)
Travel Industry Effectiveness Rate
The Travel industry delivered mixed performance this quarter, with photo and carousel Effectiveness Rate increasing 7% to 4.7%, while video saw a slight decline of 2% to 4.5%. Below is a breakdown of how photo and video Effectiveness Rate shifted within the industry this quarter:
- Average Q2 2025 Photo and Carousel Effectiveness Rate: 4.7% (+7%)
- Average Q2 2025 Video Effectiveness Rate: 4.5% (-2%)
Sharpen Your Social Strategy With Dash Social
Effectiveness Rate is a powerful metric built to keep pace with the evolving demands of content measurement. For brands incorporating video into their strategy, or looking to expand their mix, Effectiveness Rate offers a reliable way to evaluate true performance across formats.
Use content segmentation to identify your top-performing photos and videos, and consistently benchmark against your industry to accurately assess your brand’s performance. Doing so will help you set smarter, more informed goals and refine your strategy over time.
Effectiveness Rate FAQs
How do you measure success on social media posts?
To measure the success of social media posts, social marketers should first outline what post-specific social media KPIs they want to measure. A common KPI is engagement rate, but these could include effectiveness rate, clicks, follower growth, or any other metric that helps you find success in your social strategy.
For example, if your social campaign focuses on building brand awareness, you might prioritize engagement and views over metrics like website clicks or purchases. Success is determined by whether or not you reach these goals. It’s also important to know that even if you don’t reach your goals, any insights are helpful for post-campaign reflection, especially when it comes time to set post goals for your new campaign.
How do you measure the success of a social campaign?
The first step when considering how to report on successful social media campaigns is to define goals in your social media strategy. Your goals can range from reach to impressions, clicks, conversions, or whatever else makes sense in the context of your overall marketing strategy.
From there, social managers can use tools like Dash Social, platform analytics, Google Analytics, and more to track whether or not they reach their goals. It’s also important to measure these against overall performance to determine whether or not the KPIs you set for social content had a broader impact.
How do you measure the engagement of your posts?
Social marketers can measure the engagement of Instagram posts under the ‘Insights Tab’ (or the analytics tab in whatever native app you use) or with Dash Social Social Media Insights or Dashboards tools to pull in multi-channel social media analytics engagement rates for posts, Reels, campaigns, and more.