UK Social Media Stats and Benchmarks
How do UK brands perform on social media?

In the United Kingdom, millions and millions of people use social media every single day.
For marketers and those with plans to target this region, understanding average performance is vital to creating your own strategy with realistic goals that will impact your social media results and your bottom line. Metrics that look promising in the United States, for instance, may feel entirely different in a UK context. By examining social media benchmarks specific to the UK, you’ll gain insights that put your performance in perspective and help you build a strategy tailored for success in this unique market.
Dash Social analyzed nearly 175 UK Instagram and TikTok accounts year-to-date* to determine the average performance against a predetermined set of KPIs. These benchmarks include handles with a minimum of 1K followers, from both customers and non-customers. Brands span across the following industries: beauty, fashion, luxury, media and publishing, CPG, food and beverage, retail, home, baby and children and wellness.
*July 1, 2025-December 31, 2025.
Key Takeaways:
- Social media behavior in the UK differs from other regions, so brands need benchmarks that reflect local performance to set realistic goals.
- Dash Social’s analysis of nearly 175 UK Instagram and TikTok accounts shows that industry averages vary widely, with Instagram engagement at 1.6% and TikTok engagement at 4.5%.
- UK Instagram brands post an even mix of video and static content, while UK TikTok brands lean heavily on frequent video posting to maintain growth and reach.
- TikTok shows stronger reach, faster follower growth and higher engagement in the UK, reinforcing the need for consistent, video-first strategies.
- Understanding these benchmarks helps social teams tailor content, posting cadence and audience strategy to drive stronger results in the UK market.
UK Instagram Benchmarks
- Average current followers: 1,518,244
- Average weekly posts: 8
- Average monthly growth rate: 0.6%
- Average reach per post: 58,997
- Average views per post: 177,454
- Average shares per post: 413
- Average saves per post: 179
- Average engagement rate: 1.6%
- Average effectiveness rate: 3.8%
- Average Entertainment Score: 3.8
In the UK, Instagram benchmarks indicate that brands typically have around 1.5 million followers and experience a monthly growth rate of 0.6%. This reflects slower follower acquisition, but an already established larger audience, which sets brands up for a strong social media presence.
UK brands’ content strategies have them posting eight posts per week, signaling a need for diverse media types to maintain engagement. The average engagement rate for UK social brands stands at 1.6%, with each post averaging 413 shares, 179 saves, and 177,454 views. Each post reaches nearly 60K users, suggesting that content reaches a substantial segment of followers.
Additionally, an Entertainment Score of 3.8 suggests a moderate level of audience satisfaction and interest, which means there are ample opportunities for brands to further optimize content to enhance engagement and interaction on Instagram.

UK TikTok Benchmarks
- Average current followers: 474,859
- Average weekly posts: 7
- Average monthly growth rate: 2.5%
- Average reach per post: 145,415
- Average views per post: 245, 349
- Average shares per post: 171
- Average engagement rate: 4.5%
- Average Entertainment Score: 3.4
In the UK, brands have an average following of almost 475K on TikTok, with a monthly growth rate of 2.5%, reflecting a healthy expansion pace. These brands post frequently at seven average posts per week, while focusing on maintaining a regular content schedule to engage followers. TikTok videos garner around 245,349 views per post, indicating high user interest in video content.
With an engagement rate of 4.5%, UK brands achieve strong interaction levels and outperform typical benchmarks in other regions, with a reach of about 145K per post. This high engagement and reach show that this content connects with a broad audience overall.
For social media managers, this data emphasizes the importance of consistent posting and prioritizing video content to maximize reach and boost engagement rates. An average Entertainment Score of 3.4 on TikTok suggests that while this content engages UK audiences, there is still room to increase this rate by tailoring content more closely to your target demographic’s preferences. A great first step to understanding what your audience wants to see is by developing buyer personas to build a clear picture of your target customer and their likes, dislikes, and how they prefer to use content to content for entertainment and to influence purchases.
UK Social Media Statistics
UK social stats for popular platforms like Instagram and TikTok give social media managers the insights they need to fine-tune strategies, stay ahead of social media trends and drive meaningful engagement with local audiences. Here are some of the latest social statistics to keep in mind:
- There are 56.2 million active social media users in the UK.
- In the UK, social media has a 92.03% penetration rate.
- WhatsApp is the leading social media platform among United Kingdom users based on reach, while YouTube is the most well-known social network by awareness.
- Social media is the most popular among Gen Z and Millennials with 97 and 98 percent reach across both generations.
- Social media users aged 30-49 make up 46% of UK users.
- 51% of social media users in the United Kingdom are women.
Top Performing UK Brands on Instagram
The leading UK brands on Instagram stand out by leveraging a mix of content formats, like Carousels, Reels, and Stories to maintain high audience engagement. Below are the top three brands demonstrating effective multi-format content strategies:
1. Bleach London (@bleachlondon)
- Followers: 424K
- Engagement rate: 3.8%
Bleach London uses their Instagram to showcase bold, creative hair color and salon culture with a strong visual aesthetic that reflects its edgy, trend-driven brand identity. The account has built a large, engaged following by blending vibrant stylist work, product highlights, and community-focused content that resonates with fans of self-expressions and fashion forward beauty.

2. Madame Tussauds (@madametussauds)
- Followers: 227K
- Engagement rate: 3.2%
Madame Tussauds Instagram highlights its iconic wax museum experiences by sharing photos and videos of lifelike celebrity figures, interactive visitor moments, and museum highlights to engage fans of pop culture and tourism. The brand maintains a solid follower base and steady engagement while using visual storytelling to bring the attractions star-studded experience to life for a global audience.

3. Jaded Swim (@jaded_swim)
- Followers: 96.8K
- Engagement rate: 1.5%
Instagram is one of Jaded Swim’s most powerful platforms as they use it to highlight their chic, minimalist swimwear through aspirational, fashion-forward visuals often set in luxe beach or travel locales. Resonating with a stylish, trend-savvy audience, the brand uses high-quality, editorial-style imagery and storytelling to showcase its sleek designs and cultivate an elevated beach lifestyle vibe.

Top Performing UK Brands on TikTok
The following UK brands excel on TikTok by utilizing various content formats like viral challenges, trending TikTok sounds and creator collaborations to captivate their audiences and drive engagement. Here are the top three brands making the most impact:
1. Thorpe Park (@thorpepark)
- Followers: 271.8K
- Engagement rate: 6.9%
Thorpe Park is an amusement park that uses social media to showcase the thrill-park experience with exciting, ride-centric content like POV clips, highlights of major attractions, and energetic footage that taps into the adrenaline theme that defines the brand. The account engages a sizable audience with visually dynamic posts that capture the park’s atmosphere, bringing the live experience to life for followers.
2. Soap & Glory (@soapandglory)
- Followers: 64.5K
- Engagement rate: 5.8%
On TikTok, Soap & Glory mixes playful, product-centric videos with short- engaging clips that spotlight launches (like limited-edition bodycare), snappy routines, and sensory content such as ASMR-style pampering. Fun, colorful vibes and relatable beauty moments help the brand connect with a brand audience, using trends and personality to make self-care feel joyful and accessible.

3. Sisters & Seekers (@sistersandseekers)
- Followers: 246.8K
- Engagement rate: 5.4%
Sisters & Seekers’ TikTok presence leans into authentic, personality-driven content that gives users a look into behind-the-scenes moments, employee features, and relatable fashion inspiration rather than polished ads, helping humanize the brand and deepen audience connection. Their videos blend humor, team personalities, and trend-responsive creativity to entertain and build an engaged community that feels closer to the people behind the label.

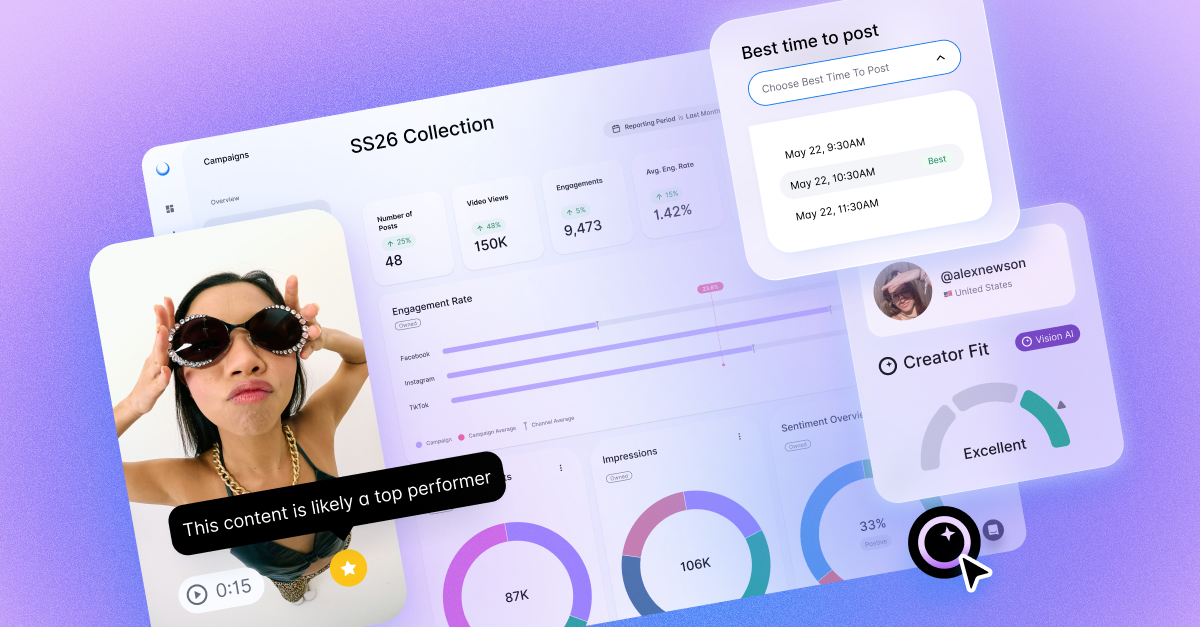
Benchmark Performance With Dash Social
Brands can leverage Dash Social's Competitive Insights and Benchmarking to measure and compare performance to competitors by analyzing engagement rates, follower growth and content effectiveness across social channels. Through Social Analytics and Monitoring, brands can see detailed insights into real-time content performance, audience behavior and more to fine-tune strategies. Along with Social Analytics, Social Media Reporting Dashboards provide customizable visualized reports to assess trends over time, so your team can easily spot opportunities to improve and capitalize on high-performing content.