How To Check and Utilize Your Twitter (X) Analytics in 2026
Find out how performance data can shape a stronger Twitter (X) strategy.
Twitter, now X, has undergone a significant transformation in recent years. Brands might have experienced a change in user demographics, engagement metrics, and other data as a result. These shifts can make finding patterns unpredictable, which makes identifying meaningful tactics to add or remove in your strategy more challenging.
To help you make sense of Twitter (X) metrics and navigate the platform’s shifts, we’re sharing tips to make the most of your X data.
TL;DR:
- X (formerly Twitter) analytics help brands understand what drives engagement, follower growth, and reach, with Premium Accounts offering deeper insights.
- Tracking core metrics like engagement rate, impressions, and link clicks reveals what content resonates most and informs smarter posting strategies.
- Accessing X analytics varies by device: the mobile app provides quick post-level stats, while the desktop dashboard offers a full performance overview.
- Focusing on the right metrics such as top-performing posts, total engagement, and net new followers keeps your strategy aligned with business goals.
- Tools like Dash Social, Sprout Social, Buffer, and Hootsuite make it easier to visualize, compare, and act on X performance data.
What Are Twitter (X) Analytics?
X, formerly known as Twitter, analytics is the platform’s built-in tool that shows you how your posts are performing beyond surface-level likes and reposts. It tracks metrics like impressions, engagement rate, profile visits, and follower growth to provide a better sense of what works and what doesn’t.
That said, X has made its analytics dashboard exclusive to Premium subscribers. If you’re not on Premium, you can still see basic engagement, including likes, reposts, and, replies, which are visible on each post. However, you’ll miss out on the deeper insights that help your team identify trends and measure long-term performance.
Why Twitter (X) Analytics Matter
Analytics provide the data you need to make smarter decisions on X. Instead of guessing what your audience likes, you can see exactly which posts drive impressions, engagement, and profile visits. These insights help you refine your content strategy, double down on what works, and cut back on what doesn’t.
For brands and creators, this level of visibility is key to growth. Analytics reveal when your audience is most active, which content formats perform best, how to boost Twitter (X) engagement and how this can translate into follower growth. By understanding the numbers behind your posts, you can turn content into a tool for stronger connections and measurable results.

How To Check Twitter (X) Analytics
Checking your X Analytics can be done in a few different ways, depending on what level of insight you’re after.
Beyond the platform’s own tools, many third-party social media management tools also provide analytics, often with added features like cross-platform comparisons and campaign tracking. Whether you stick with X’s native reporting or use external tools, knowing how to access these insights is the first step to understanding your audience and improving your Twitter marketing strategy.
Access Twitter (X) Analytics on Mobile, Via App
While X’s mobile app doesn't offer a dedicated analytics dashboard like the desktop version, it still gives quick access to performance data on individual posts. To check analytics:
- Open the X app and navigate to your profile.
- Find a tweet you want to analyze and tap the bar graph icon underneath it.
- A pop-up will display key metrics like impressions, engagements, profile visits, and engagement rate.
This mobile-friendly view is perfect for checking how a recent tweet is performing without needing to leave the app. However, for more detailed reporting, you’ll need to use a browser.
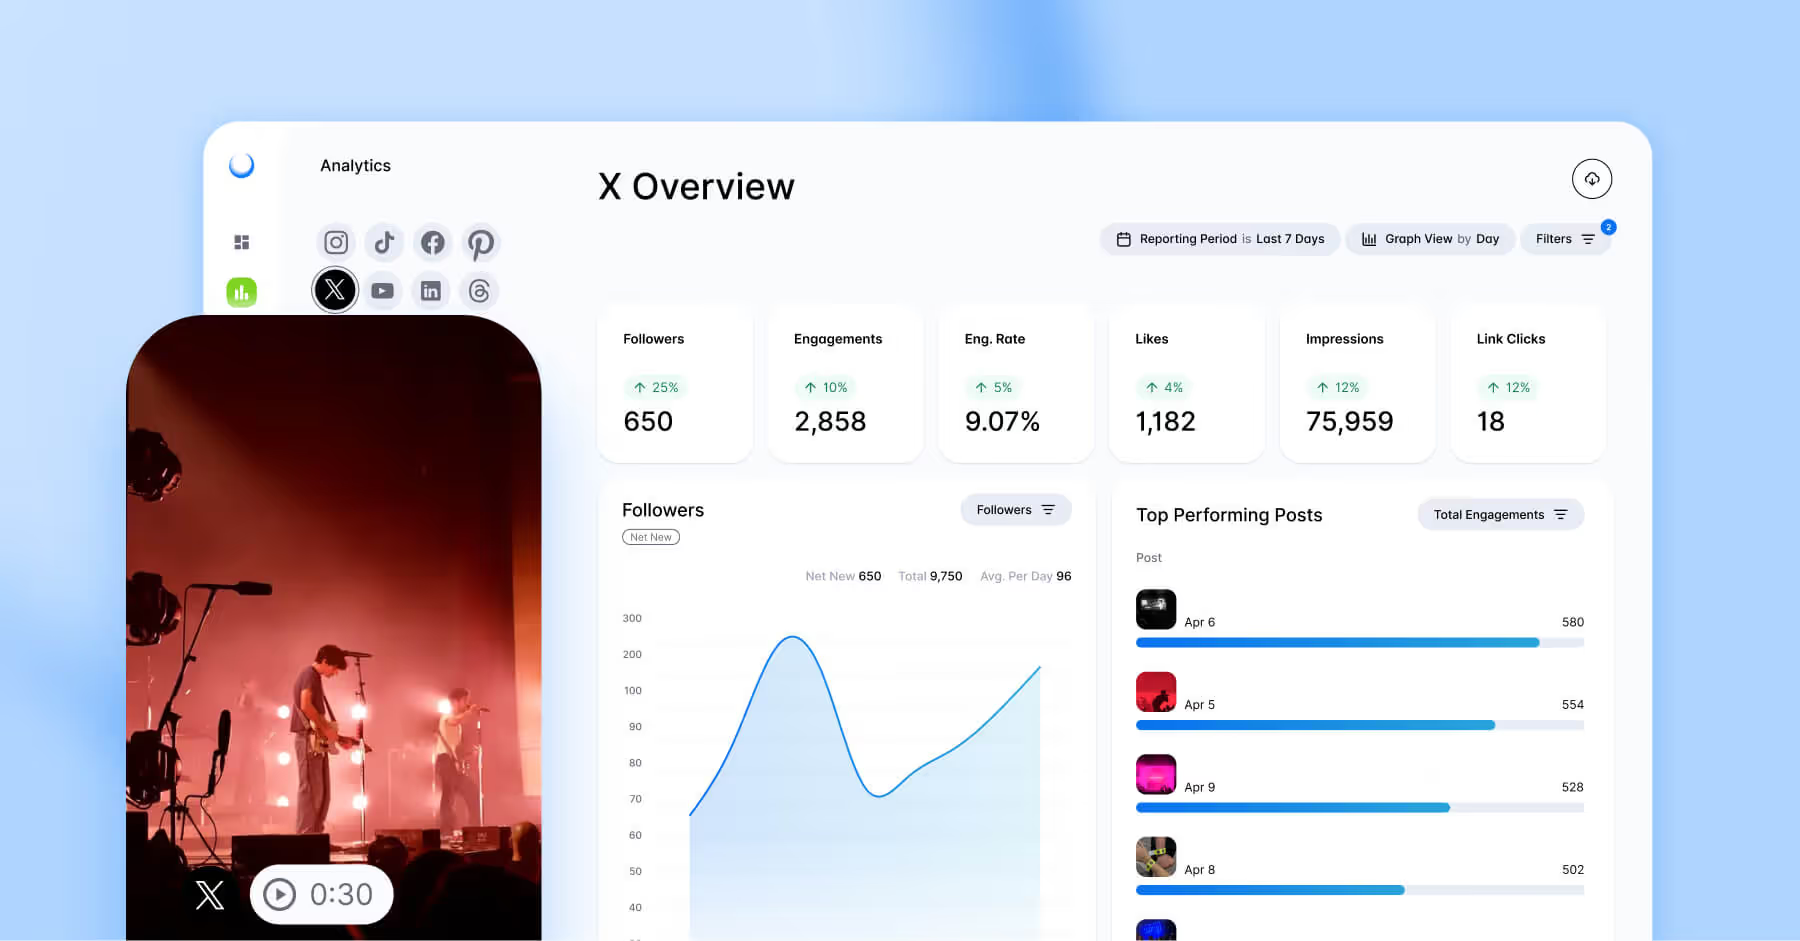
Access Twitter (X) Analytics on Desktop or Mobile Browser
X offers a more robust analytics experience on desktop. Here’s how to access X Analytics on desktop:
- Go to https://x.com/i/account_analytics and sign in with your X account.
- From there, you’ll see the ‘Account Home’ page, with a 28-day view of your posts, impressions, profile visits, and engagement rate.
- You can use the dropdown to toggle between different metrics like replies, reposts, likes, and bookmarks. You can also switch between line and bar graphs.
- To see metrics for individual posts, click ‘Content tab’ to see individual posts.
The Benefits of Using Twitter (X) Analytics
X Analytics gives you more than just numbers. It helps you understand your audience, measure performance, and shape an overall smarter strategy so you can find success within the Twitter algorithm. By using analytics, you can base pivots in your strategy on real data and understand how people engage with your posts.
Better Understand Your Target Audience
Your X followers are more than just a number on your profile. Analytics shows you how they interact with your content, when they are most active, and what they engage with most. This information helps you create posts that meet your audience where they are, making your content feel more relevant and intentional.
Learn What Content Types Resonate
Not all posts perform the same. Twitter (X) analytics help you reveal whether your audience responds more to photos, videos, or text-based updates. By tracking impressions and engagement rates, you can see patterns in what gets attention and use that knowledge to shape future posts. Over time, this leads to a more consistent strategy, stronger results, and a content audience that’s getting more of what they want to see on their timeline.
Monitor Conversations
X is a platform built on conversations, and analytics help you track how those conversations unfold around your brand. You can see which topics spark replies, what content gets shared, and how often your profile is visited. Monitoring these trends lets you stay connected to your audience and find opportunities to join in on discussions that matter to them.
Twitter (X) Metrics To Track
Not every metric on X will matter equally to your strategy. The key is to focus on the numbers that directly connect to your goals. For example, if brand awareness is not a priority, impressions may not be the best measure of success. On the other hand, if driving conversions is your top objective, link clicks will tell you more about whether your content is driving results. By choosing the right metrics to monitor, you can avoid distractions and zero in on the data that helps move your strategy forward.
Top Performing Posts
Looking at your top posts helps you identify what resonates most with your audience. These posts often highlight the type of content, format, or message that captures attention, giving you a blueprint for future success.
Net New Followers
Tracking the number of new followers you gain over a specific period shows whether your content is helping you grow your Twitter community. A steady increase can indicate your content is reaching the right people and encouraging them to stick around.
Total Engagement
Engagement reflects the total number of times people interacted with your content, including likes, replies, reposts, and clicks. High engagement signals that your content is connecting with your audience in a meaningful way.
Likes
Likes may feel simple, but they are a clear indicator of content approval. While they should not be the only metric you focus on, likes can still help you gauge audience sentiment quickly.
Impressions
Impressions show how many times your content was displayed on X. This is a useful metric for measuring reach and brand awareness, though it is not always the best measure of overall performance if your main goal is conversions.
Link Clicks
If conversions or driving traffic to a landing page is your main objective, link clicks are one of the most important metrics to track. They show how often users take the next step beyond engaging with your content on X.
Video Views
Video views measure how many times people watched your video content. This metric can help you understand if your videos are catching attention and holding interest long enough to deliver your message.
Twitter (X) Analytics FAQs
How do you find audience insights on Twitter (X)?
You can find audience insights by setting up a Twitter Premium Account and looking at analytics data like engagement rate, follower growth, and profile visits. These numbers show you not just how many people follow you, but how they interact with your content.
How to use Twitter (X) for industry insights?
Twitter is a powerful place to monitor conversations happening in your industry. Follow relevant hashtags, keep an eye on trending topics, and track mentions of key players or competitors. By doing this, you can spot emerging trends, understand what your audience cares about, and join discussions that matter. Analytics can also help by showing which of your posts on industry topics get traction, giving you clues about where to focus your content.
How to see Twitter (X) analytics?
To access Twitter (X) analytics, you need a Premium subscription. If you’re not subscribed to Premium, you’ll still have access to basic engagement counts directly under each post, including likes, replies, reposts, and views. These numbers can help you track individual performance, but you won’t have access to deeper reporting.
How do Twitter (X) analytics work?
Twitter (X) Analytics collects data from your activity on the platform and organizes it into measurable insights. Every impression, like, reply, repost, and click is tracked. These interactions are then displayed in your dashboard so you can see patterns over time. The data updates regularly, giving you a near real-time look at how your content performs and how your audience grows.
How do I find my most liked Tweet?
Finding your most liked tweet is simple. Go to your profile, click the ‘Likes’ filter under the search bar, or scroll through your posts to spot which one has the highest number of hearts. If you have access to X Analytics, you can also look at your top-performing posts in the dashboard, which highlights the tweets with the most engagement, including likes. This is a great way to understand what kind of content earns the strongest positive response.
Why are my Twitter (X) impressions high, but engagement is low?
High impressions with low engagement often mean people are seeing your content, but aren’t interacting with it. These metrics suggest your message or content might not resonate with audiences and needs adjusting. Tweak your content and revisit your analytics to see if you’ve improved engagement rates.
Can I use analytics to improve my posting strategy?
Yes, you can use analytics to improve your posting strategy. By analyzing when your posts perform best, which formats drive engagement, and what topics spark conversation, you can refine your approach to get stronger results over time.
How can I use analytics to find my best-performing posts?
Look for posts with the highest engagement or impressions. These highlight the type of content and format your audience responds to, which you can replicate in future posts.