Pinterest Analytics: What You Need to Know
Understanding and unlocking your Pinterest analytics is the key to building a successful strategy. Use this blog to uncover which metrics to track, where to find them, and what tools you should enlist to help.

More people than ever use social media to figure out which products to buy, and no social channel fuels product discovery like Pinterest. The visual Pin-based channel is the perfect place for all of your content to live. With the addition of Idea Pins, your ability to tell your brand story using text, images, and video has never been more customizable.
Now is the time to start investing in your Pinterest analytics and strategy.
Key Takeaways:
- Pinterest plays a unique and important role in the buyer journey. Brands must leverage analytics to ensure they aren’t missing a single sale.
- To get the most out of your Pinterest analytics, you must convert your account to a business account to access all the needed metrics.
- You don’t need to track every analytic in the book to see success. Choose what makes sense based on your goals and track from there.
- Use Pinterest analytics to find content themes, improve CTR, gain audience insights and trends, and optimize landing pages on your website.
What Are Pinterest Analytics?
Pinterest analytics are a collection of metrics that give you a comprehensive view of your brand’s performance on the platform. These individual metrics reveal what’s working (and what’s not), helping you understand which types of content resonate with your audience and what steps you need to take next to improve your overall Pinterest strategy.

Why Are Pinterest Analytics Important?
Tracking your Pinterest analytics across mobile and desktop is crucial because it provides deeper insight into what your target audience is actively searching for and engaging with. Metrics like Pin impressions, engagements, video views, and your top-performing Pins are strong indicators of which content pillars your brand should continue investing in.
Without this data, it becomes extremely difficult to understand how users are interacting with your content, making it nearly impossible to optimize your Pinterest strategy effectively.
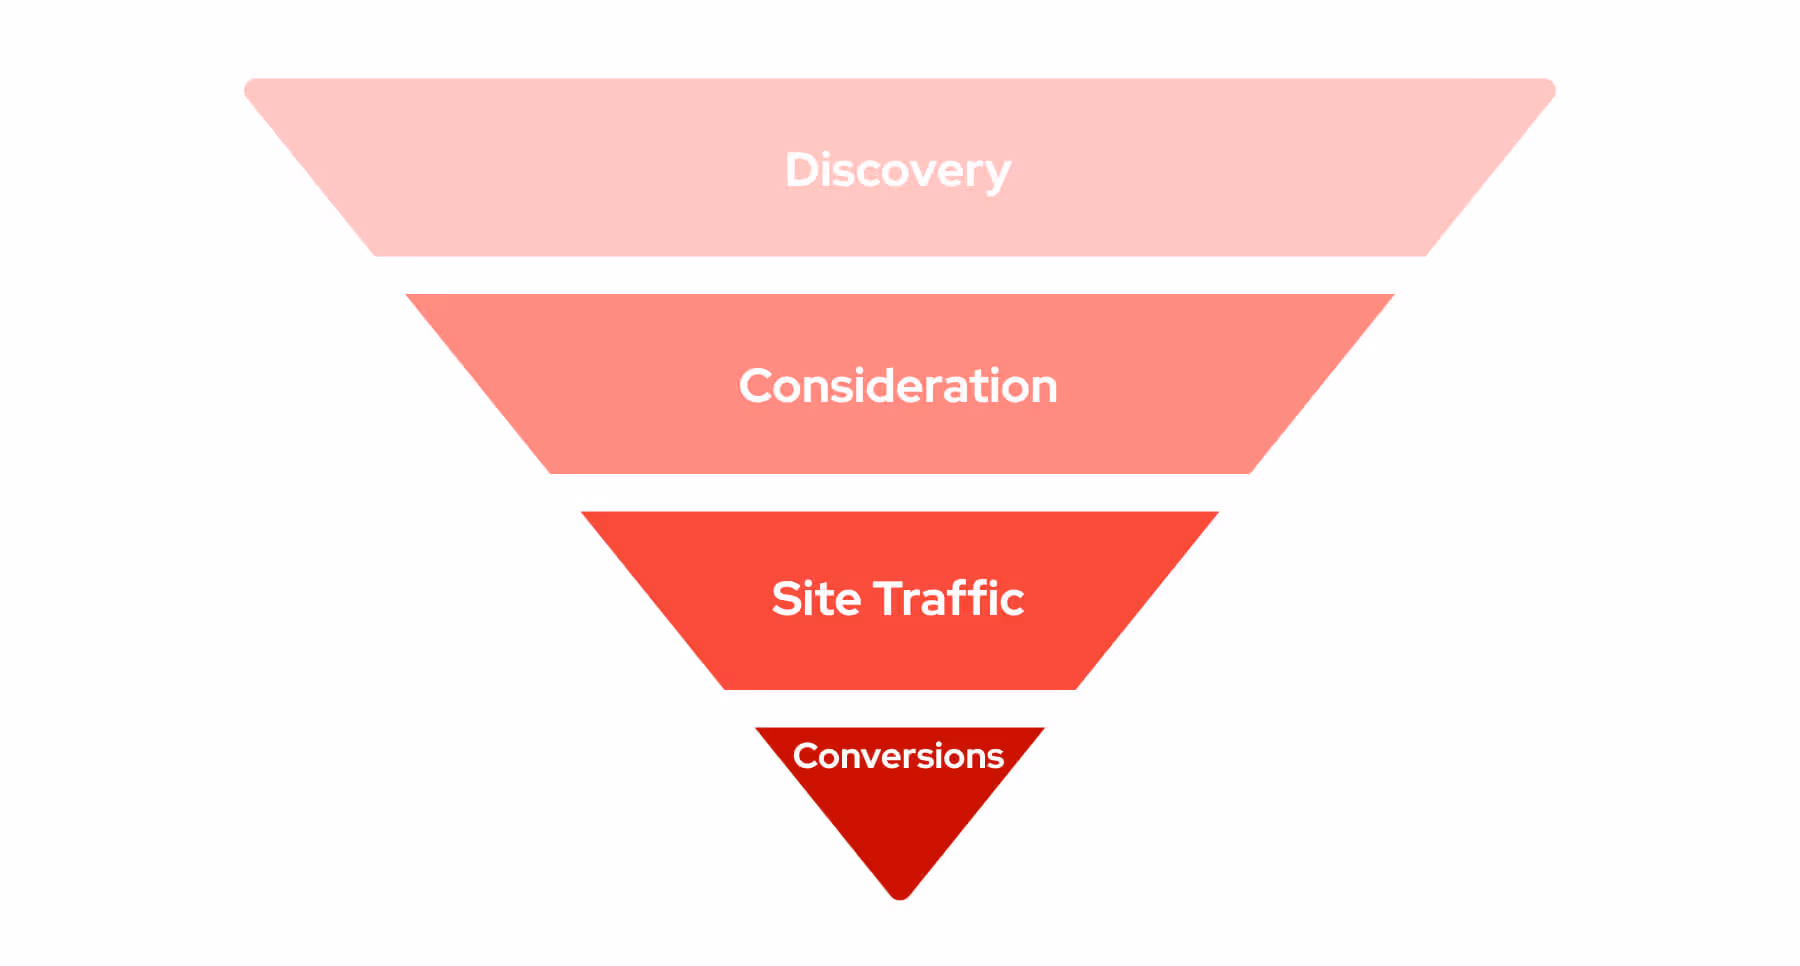
Pinterest’s Role in the Marketing Funnel
Pinterest is a visual discovery engine first. Pinners thrive on the alchemy of searching and being served actionable and engaging content on Pinterest, and brands have made their stake on the channel. No matter which stage of the buying cycle users are in, from discovery to conversion, they are in a purchasing mindset.
How To Set Up Pinterest Analytics for Accurate Data
To ensure you’re getting the best data Pinterest has to offer, there are a couple of small but mighty hoops you’ll have to jump through, including:
- Converting to a Pinterest Business account: This step cannot be missed. A Pinterest Business account ensures you have access to your analytics, and luckily, it’s extremely easy to set up. Just go into your account settings, click ‘Account Management’ and select ‘Convert to a business account.’
- Claiming your website: You’ll want to do this because it opens up custom Pinterest analytics in relation to all of the Pins published from your website. You can claim your website by going to the ‘Claimed Accounts’ in your settings and adding your website URL.
- Enabling Pinterest tag: By enabling this feature within Ad reporting, you can track ad conversions such as page visit, add to cart, lead, signup, and more to get a more holistic view of where users are converting. For best practices and tips, read our Pinterest advertising strategy blog.
- Adding UTM parameters to links: This step is small but impactful. Adding UTMs to links ensures that traffic is properly attributable in your web analytics and that you know exactly where it’s coming from.

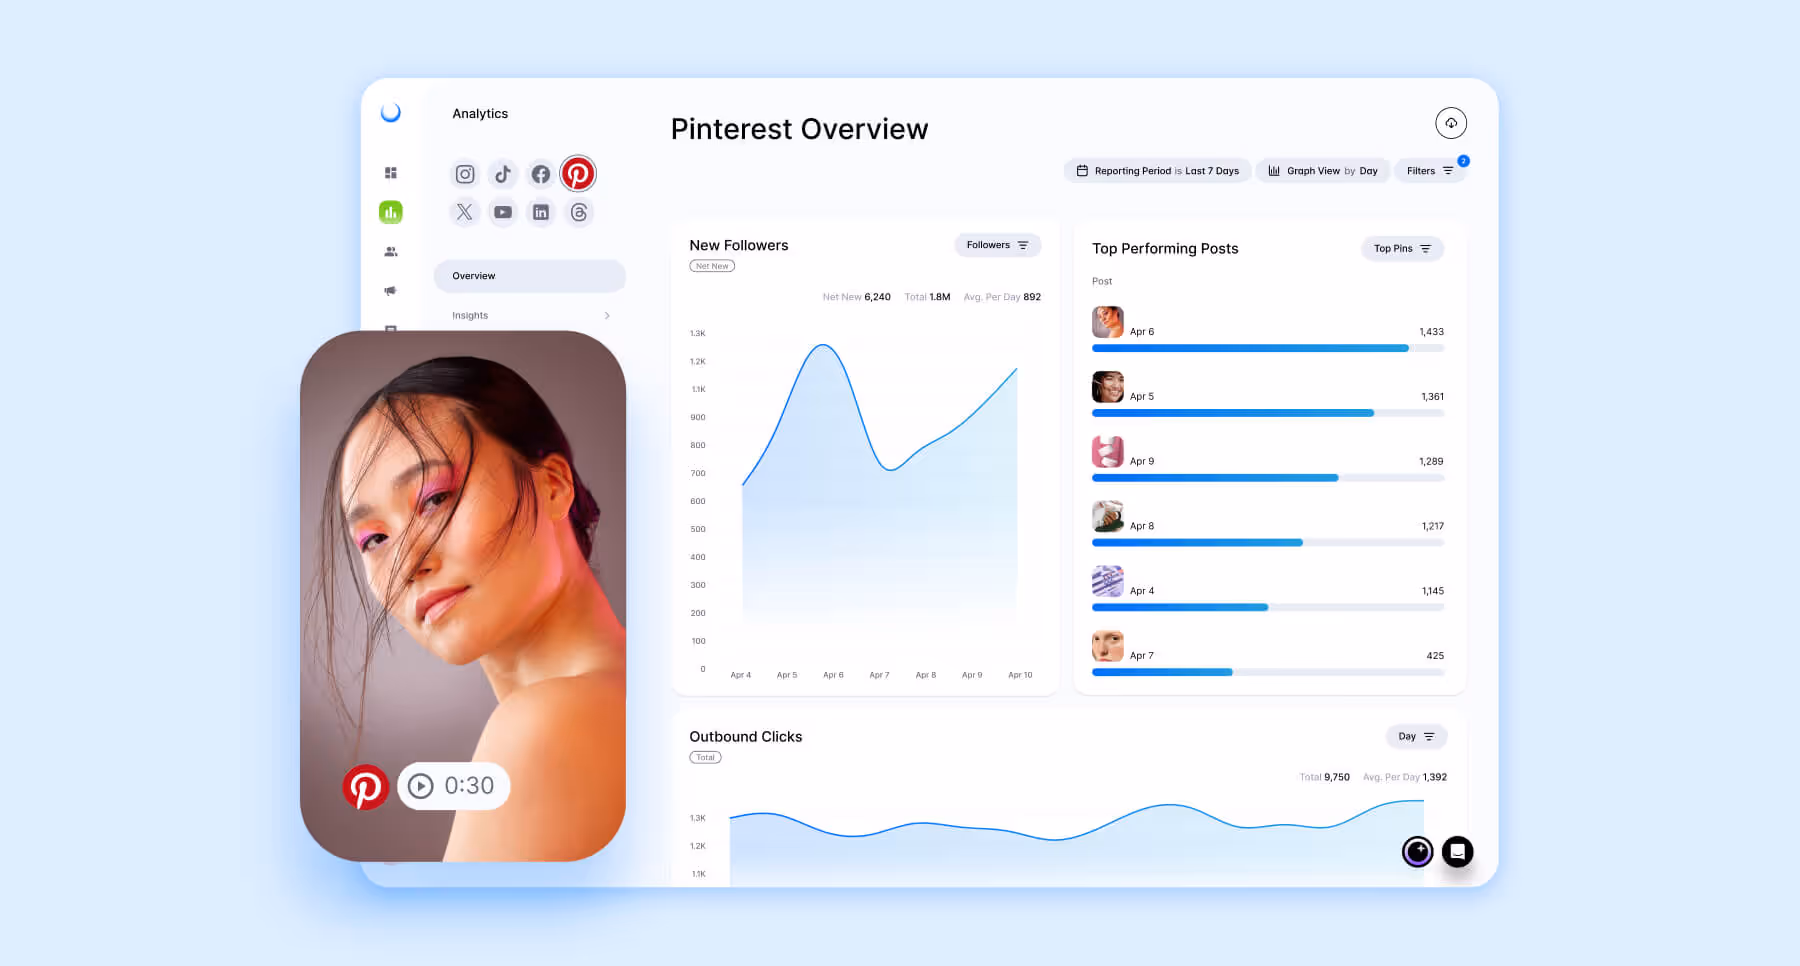
How To Access Pinterest Analytics
Now that you’ve set yourself up for success, it’s time to get to the fun part: exploring your Pinterest analytics. The great thing about this is that there isn’t just one way to access them, meaning you can view your analytics in the way that best suits you and your strategy. Let’s break down how to access your Pinterest analytics on desktop, mobile, and even through third-party social media analytics tools.
Access Pinterest Analytics on Desktop
Chances are, your desktop is where you will access your Pinterest analytics from most frequently. The desktop capability almost always has more customizable options and can show you the bigger picture when it comes to your performance. This is how you access them:
Step 1: Log in to your Pinterest account on your desktop browser.
Step 2: Click the menu in the top-left-hand corner of the page.
Step 3: Select ‘Analytics’ from the ‘Analyze Performance’ menu.
Step 4: Lastly, you can filter your analytics through several different lenses, including Overview, Audience Insights, Conversion Insights, and Trends.
Access Pinterest Analytics on Mobile
While viewing your analytics on your phone may not be your go-to for data pulling and reporting, it’s a great way to quickly check performance when hopping between events or meetings. Here’s how it works:
Step 1: Download the Pinterest app on your mobile device and log in to your account.
Step 2: Click the person icon in the bottom right-hand corner to navigate to your profile and then tap your profile image.
Step 3: Click the bar graph icon to access your analytics dashboard.
Step 4: Select your desired analytics section: Overview, Content, or Audience metrics.
Accessing Pinterest Analytics Through Third-Party Tools
Third-party Pinterest analytics tools vary in how they work, so they’re not always as straightforward as Pinterest’s native dashboard. But don’t let that scare you away. The insights you can gain from a third-party tool far extend past Pinterest’s native capabilities, meaning they’re not just a nice-to-have but a necessity for anyone looking to improve their strategy.

The Pinterest Metrics That Actually Matter
Not all metrics are created equal. This means it's important to be deliberate about which ones make their way into your reporting repertoire. Here are the metrics that matter broken down into the categories of Awareness and Reach, Engagement Quality, and Traffic and Site Intent.
Awareness and Reach
Channel growth takes center stage, especially on Pinterest. These awareness and reach metrics give insight into how your content resonates on the platform and how many people see it.
Follows
Follows reflects the amount of users who are already following or follow your account.
Why it matters → While followers are becoming less and less important in comparison to engagement, keeping tabs on your growth is still needed, as the growth percentage often reflects account health.
Benchmark: 0.3% monthly growth rate (Source: Dash Social Benchmark Report)
How to adjust it → If you’re looking to get more followers on Pinterest, try branching into different content types to reach new audiences.
Impressions
To receive an impression, at least one pixel of a Pin must be visible for one continuous second. Impressions are often used to measure content visibility.
Why it matters → Impressions are often one of the most misleading and misunderstood metrics. A Pin may have a lot of impressions, but you’re not seeing other results because each impression may have fit within that one-second threshold. While it’s important to ensure your impressions are within a healthy range, you should focus more on metrics like engagement rate or video views.
Benchmark: 1.0K per post (Source: Dash Social Benchmark Report)
How to adjust it → If you’re not happy with your number of impressions, you will want to work on your overall brand visibility on the platform. Create content that users will want to share and get in front of as many eyes as possible.
Total Audience
Total audience on Pinterest refers to the number of unique users who have viewed or engaged with your content within your specified time frame.
Why it matters→ By checking your total audience, you can get a clearer read on how many people your content is reaching. These are good high-level numbers to share with your team to show the impact of your content.
How to adjust it → To reach a larger audience, follow Pinterest’s best practices and optimize for the Pinterest algorithm. Content that aligns with these guidelines is more likely to be widely shared and seen.
Video Views
For something to count as a video view, a user must watch at least two continuous seconds of the video with at least 50% of the video in frame.
Why it matters → Video is the most engaging type of content you can post to not just Pinterest, but any social channel. If you’re putting in the effort to create great video content, you want to keep an eye on this metric to ensure your hard work is paying off.
Benchmark: 690 video views per post (Source: Dash Social Benchmark Report)
How to adjust it → To get more views on your videos, look at what types of content are trending on Pinterest and also the types of content your competitors are posting that are getting the most views. It may be as simple as adding text or a sticker in your first frame.
Weekly Posts
Refers to the amount of posts your brand or account is posting in a single week.
Why it matters → How often you post on Pinterest can impact impressions, engagement rate, and saves. Keep an eye on your cadence to ensure you’re not posting too much or too little.
Benchmark: 32 posts per week (Source: Dash Social Benchmark Report)
How to adjust it → Posting way too much? Simply spread out your content calendar to see if this impacts your results. If you’re posting too little, brainstorm new content ideas with your team, or better yet, repurpose content from your other channels.
Engagement Quality
The quality of your engagement is more important than the engagement itself. These metrics allow you to drill down into how your content is reaching the right audience and how they’re responding to it.
Engagement Rate
Engagement rate is the percentage of users interacting with your content in any way, through saves, clicks, swipes, or other actions.
Why it matters → Engagement rate is the new follower growth. This metric has become the most indicative of how your content is really performing with your audience and beyond. Low engagement means something in your Pinterest strategy needs to change.
Benchmark: 1.5% average engagement rate (Source: Dash Social Benchmark Report)
How to adjust it → If your engagement rate is dipping below the average, it’s time to look at your content strategy as a whole. Identify which content received good engagement versus bad engagement rates. Do a deep dive into what’s different about these pieces of content and how you’ll replicate the high performers.
Pin Clicks
A Pin click (or close-up) activates when someone clicks on a specific Pin to view it larger, read the description, or see more.
Why it matters → Pin clicks and Pin click rate are excellent indicators of how your content is landing with users. Seeing what types of content they click into and want to learn more about helps inform the content you should be creating more of.
Benchmark: 26 Pin clicks per post (Source: Dash Social Benchmark Report)
How to adjust it → If you want to receive more clicks, look into creating content that users will want to learn more about. Enrich your descriptions with eye-catching information, and create content that users will want to see on a bigger scale.
Saves
A save is when a Pinterest user bookmarks or saves your content to their board to refer to later.
Why it matters → Saves help predict future reach and what is valuable to your users. They are one of the most useful metrics because they show that your content is resonating so much that users want to either reference later or send to someone else.
Benchmark: 4 saves per post (Source: Dash Social Benchmark Report)
How to adjust it → To foster more saves, focus on creating content that users would want to reference again. This could be as simple as a recipe if you’re a food brand, or a step-by-step tutorial of how to use a specific product.
Traffic and Site Intent
Traffic and site intent metrics are enormously valuable because they show you what happens far beyond social. These metrics enable you to gain insights into where users are heading, which pages they’re visiting, and most importantly, what they’re buying.
Outbound Clicks / Outbound Click Rate
An outbound click occurs when a user clicks something that brings them to a location outside of Pinterest, such as an online shop or website.
Why it matters → Most brands post on Pinterest to attract people to their websites or encourage them to buy their products. Tracking and measuring outbound traffic and click rates are crucial to ensuring that your efforts are paying off.
How to adjust it → To increase your outbound clicks and click rate, have strong CTAs that drive users to wherever you want them to go. Users need to be led, and by creating an interactive and engaging experience, you’re much more likely to get them on your site.
Page Visits
A page visit on Pinterest refers to the amount of time a Pinner leaves Pinterest to go to your website (or another external site) after interacting with your content.
Why it matters → Knowing where a user is coming from and how they got there can help you create the perfect end-to-end journey for users.
How to adjust it → Much like outbound clicks, if you want to increase your page visits, you want to focus on creating a place for your users to go. Alongside clear CTAs, consider having unique content or codes that await users after leaving Pinterest to visit your site.
Add-to-Cart/Checkouts
Clicking on Product Pins brings up the ‘Add-to-Cart’ button, which takes users directly to the seller's website, where they can purchase the item. Checkouts allow users to complete their transactions directly in the Pinterest platform.
Why it matters → As a brand, you should know what items resonate with Pinners so much that they need to purchase them immediately.
How to adjust it → To get more users to buy your products through Pinterest, be sure to lead with value. Show Pinterest users exactly why they need your product and how easy it is to buy it right through the app.
Top Converting Pins/Boards
Your top converting Pins and boards are those that are the most effective at driving your desired outcome.
Why it matters → You can and should use your top-performing content as a guiding light for your Pinterest strategy. By understanding what types of Pins users are interacting with, you can scale that concept for real growth and success on the platform.
How to adjust it → Test and trial different types of content to see what really resonates with users and what keeps them engaged.
Turning Pinterest Insights Into Action
Having all of your Pinterest data at your fingertips is great, but how do you translate it into actionable insights that will actually make a difference? Below, we discuss four easy ways you can use your Pinterest analytics to start making change today.
1. Find themes that earn saves and replicate them
One of the best ways to easily utilize metrics on Pinterest is to find running themes in user behaviour, especially when it comes to saves. Dive deep into which of your own posts users are saving, and then level it up by digging into the different types of content that are being saved from your competitors. Once you know which types of Pins are performing, work to replicate those vibes (in your own way) to see the saves pile up.
2. Improve CTR with creative
If you’re looking to boost your click-through rate, your Pinterest analytics will be able to inform exactly how you should do it. More often than not, CTR will improve with simple creative updates. Use your metrics to test out different types of content to learn what titles speak to Pinterest users, whether they like text overlays or not. These creative tweaks can be the difference maker when it comes to someone clicking on your Pin (or not).
3. Use audience insights and trends to plan seasonal content
Audience insights on Pinterest can be used for many things, but are especially useful when it comes to planning trending or seasonal content. Learn more about where your audience is located and what age they are to know which trends you should focus on or what holiday marketing you don’t want to miss. Your audience metrics are a goldmine that can help inform just about every element of your posting schedule.
4. Optimize landing pages for traffic
The insights you gain from your Pinterest analytics don’t need to be limited to action or change just on your social account. You can use these insights to inform the types of visuals users want to see on your website, more specifically, the landing pages you’re driving them to from your Pinterest account. Beyond social performance, consider things like visual continuity (telling the same story from platform to website) and mobile page speed, to keep the experience between sites as smooth as possible.
Best Pinterest Analytics Tools
While Pinterest’s native analytics can often suffice for brands earlier in their strategy, brands looking to get the most out of their Pinterest will use a third-party tool. There are plenty across the market, so what sets a great tool apart from the rest? Below, we highlight the top contenders and what makes each one stand out.
Dash Social
Built with the most important brands in the world in mind, Dash Social's Pinterest Insights surface meaningful data that inform which Pins you’ve created are engaging a brand's target market, and ultimately, driving traffic and revenue. Gain access to powerful, granular insights that can be filtered by board, category, link clicks, and more. Layer in AI-powered content predictions to help plan and optimize your content strategy, and now you’ve got a library stocked with content that cannot lose.
With Dash Social, brands can easily uncover what visuals are inspiring action from Pinners, monitor KPIs in one place, and even bulk publish content.
Hootsuite
With Hootsuite, brands can pull Pinterest performance to track key metrics like impressions, saves, clicks, and engagements and publish and schedule all from the same dashboard. Within the Post Performance view, see up to 100 of your most recent Pins and with campaign reporting, tag posts and filter by campaign to get a top-down view of exactly how a specific campaign is performing. Furthermore, compare your performance on Pinterest alongside other channels to uncover how Pinterest is contributing to your broader marketing initiatives.
→ Compare Dash Social vs. Hootsuite

Later
Later can be used to track overall performance trends and weekly or monthly growth on your Pinterest account. You can drill further into Pin performance by filtering through saves, followers, comments, and clicks to see exactly what’s driving performance and engagement. Though Later can only show analytics for Pins that were scheduled through the Later platform, users have access to flexible filtering, content comparisons, and schedulable exporting capabilities that make reporting on performance easier than ever.
→ Compare Dash Social vs. Later

Pinterest Analytics FAQs
What’s the difference between Pin clicks vs. outbound clicks?
A Pin click is any click on a Pin that leads to any destination on or off Pinterest. In contrast, an Outbound click refers to clicks that specifically take a user away from Pinterest to another piece of content or website.
How can I use Pinterest analytics data to refine my content strategy?
Pinterest analytics can be used to refine your strategy in many ways. If you’re just starting to use Pinterest analytics, start small by measuring metrics like follows, impressions, and Pin clicks. These simple metrics will help you understand what users are liking (and what they aren’t), ultimately allowing you to refine your content to produce what users love most.
I’ve seen an increase in repins, but impressions are dropping. What should I do next?
The first thing you should do is check in on your content posting cadence. You may be seeing an increase in repins simply because you’re posting more content, but as we all know, more isn’t always better (which is why you could see your overall impressions dropping). If your cadence is standard, it may be time to look into who is repinning your content. It’s possible that the accounts repinning are smaller or don’t drive the reach you would normally expect. Do some research into the types of Pinners you want to be interacting with your content to see what types of content they are repinning. Use those findings for some inspiration moving forward.
How often should I report on my Pinterest performance?
The most important thing when it comes to reporting on your Pinterest analytics is consistency. By keeping tabs on your performance over the same time periods, you will have more accurate data and be able to see what moved the needle. While some brands opt for reporting on their Pinterest performance weekly, others find that monthly or even quarterly is sufficient. Find a cadence that works for your brand and ensures positive results.