Facebook Benchmarks Based on Follower Size (2026)
Unlock the latest Facebook benchmarks to see how your brand stacks up and where you can improve.
.avif)

Benchmarking serves as a strategic compass that helps guide decisions for continuous improvement. In an environment where consumer preferences and online platforms shift rapidly, Facebook benchmarks give marketers a critical frame of reference to compare your brand's performance metrics against industry standards and competitors. This gives you and your team valuable insights into your relative position in the market.
The benefits of benchmarking extend across various facets of a marketer's Facebook account and overall social media strategy. For instance, it aids in setting realistic and data-driven goals and helps ensure that targets are not just aspirational but grounded in industry realities. It also plays a pivotal role in performance analysis, helping marketers understand how their campaigns fare in terms of engagement, reach, conversion rates and other key performance indicators.
Key Takeaways:
- Use Facebook benchmarks to understand how your performance compares to similar brands.
- Set realistic goals based on follower size, engagement rates and growth trends.
- Track visibility, engagement and audience growth to identify strengths and areas for improvement.
- Review benchmarks regularly to adapt to platform changes and evolving audience behavior.
- Turn benchmark insights into action by refining your content strategy, posting cadence and campaign goals.
Understanding Facebook Benchmarks
Understanding Facebook benchmarks can inspire innovation and creativity in your team. By observing the best practices of industry-leading competitors, you can adapt and refine strategies, tailoring them to your unique brand voice and objectives. In essence, benchmarking on Facebook is not just about keeping up with the competition; it's about leveraging data to make informed, strategic decisions that propel a brand forward in a competitive marketplace.

What Are Facebook Benchmarks?
Facebook benchmarks are specific metrics used to measure and compare the performance of Facebook marketing efforts against industry standards, competitors, or past performance. These benchmarks typically include key performance indicators (KPIs) like engagement rates, Viewers, click-through rates, conversion rates and follower growth. By analyzing these benchmarks, marketers can gauge the effectiveness of their Facebook strategies, find areas to improve and adjust their tactics to better align with their target audience and marketing objectives.
Why Are Facebook Benchmarks Important?
Benchmarks are vital for planning a Facebook marketing strategy. They can help guide strategy, content creation, ad spending and are an essential part of the competitive analysis phase. Performing a Facebook competitive analysis is a crucial step in social media marketing where engagement rates, follower growth and content virality often define success. Facebook benchmarks offer a roadmap for marketers to navigate the complexities of social media effectiveness, ensuring their efforts align with industry best practices and yield optimal results.

Key Facebook Benchmarks to Track Based on Follower Size
Though the importance of followers on Facebook and other social platforms isn’t as essential as it once was, your follower count still impacts your overall Facebook metrics.
Here’s what we unearthed when we dove into the data:
- Large Brands (850K+): Large brands (850K followers or more) with high brand awareness typically have lower engagement rates due to many followers who don’t necessarily engage with their content.
- Established Brands (100-850K Followers): Established brands (100-850K followers) have higher engagement rates than large brands, likely due to a more even balance of followers, interactions, and a highly engaged audience.
- Growing Brands (0-100K Followers): Growing brands have the best average engagement rate due to the lower amount of followers and a smaller, far more engaged audience
Where does your brand fall in Facebook’s industry benchmarks? We explore various Facebook social media benchmarks, so your team can better set goals and measure their results. Keep reading to explore the average Facebook benchmarks for large brands, established brands and growing brands.
Average Engagement Rate on Facebook
The overall average Facebook engagement rate is 1.0%. While most of the data for other KPIs below often see a consecutive increase or decrease as accounts grow, engagement is a bit different. Larger brands see the lowest engagement rates, which makes sense due to their large followings. Depending on how many other pages their audience follows and how their Facebook algorithm delivers content, they might see your content less than other brands.
- Large Brands (850K or more): 0.8% average engagement rate
- Established Brands (100K-850K): 0.9% average engagement rate
- Growing Brands (0-100K): 1.2% average engagement rate
Facebook Average Monthly Growth Rate
The average monthly growth rate on Facebook is 0.6%. Naturally, the more followers a brand amasses, the lower its monthly growth rate. Brands should be mindful of this and adjust their goals accordingly as they earn more followers.
- Large Brands (850K or more): 0.04% average monthly growth rate
- Established Brands (100K-850K): 0.4% average monthly growth rate
- Growing Brands (0-100K): 1.2% average monthly growth rate
Facebook Average Weekly Posts
On average, brands post 26 posts weekly. Perhaps unsurprisingly, growing brands post the least, while large brands post the most. A HubSpot study determined that Facebook pages with over 10,000 followers tend to earn more clicks per post, which means many brands increase posts as they accrue followers.
- Large Brands (850K or more): 67 average weekly posts
- Established Brands (100K-850K): 19 average weekly posts
- Growing Brands (0-100K): 9 average weekly posts
This data was collected from July 1, 2025-December 31, 2025, across all industries including beauty, fashion and luxury, CPG, and more.
Note: As of June 2026, Meta replaced Facebook Reach with Viewers. Viewers measures the number of unique accounts that saw your content at least once and uses Meta's Accounts Center to reduce duplicate counting across connected accounts. Depending on your reporting period, you may see Reach in historical data and Viewers in current reporting.
How To Use Facebook Benchmarks To Improve Your Strategy
Leveraging benchmarks is crucial to refine your strategy and stay ahead of the curve. To effectively use Facebook benchmarks, start by identifying key metrics that align with your goals, such as click-through rates, Viewers, engagement levels, or follower growth. Compare these metrics against industry standards or competitors to gauge your performance.
Social teams can also utilize Facebook's native analytics tools or third-party platforms for a comprehensive view of your data over time. This comparison not only highlights areas of strength but also pinpoints opportunities for improvement.
Additionally, consider the context behind the numbers—seasonal trends, algorithm changes, or market shifts can all influence benchmarks. By understanding these factors, you can make informed adjustments to your content, targeting, and engagement strategies, ensuring your Facebook presence is not just competitive but also cutting-edge.
Setting Realistic Goals Based on Benchmarks
Setting achievable marketing goals is often heavily informed by benchmark data. Benchmarks, in this context, are not just numbers but narratives that tell us where we stand in relation to our peers and the industry at large. They offer a clear-eyed view of what's achievable, helping to tailor goals that are both aspirational and attainable. To set achievable marketing goals, start by diving deep into benchmark data relevant to your industry, audience size, and platform specifics. This could include metrics like engagement rates, follower growth, or conversion rates from similar-sized companies or competitors. The key is to understand not just where you want to go, but what's realistic based on where others have been.
Once you've established your benchmarks, follow these strategies to ensure your content performance not only meets but exceeds these standards:
Analyze and Adapt
Regularly review your performance data against your benchmarks. Identify gaps and analyze the content that's performing well. Use these insights to adapt your strategy, focusing on what works and tweaking or discontinuing what doesn't.
Engage and Experiment
Engagement is the currency of social media. Foster it by being responsive to your audience and experimenting with different types of content, posting times, and engagement strategies. Keep an eye on how these experiments stack up against your benchmarks and adjust accordingly.
Leverage Trends Wisely
Jumping on every trend isn't the goal; it's about selecting those that align with your brand and resonate with your audience. Use trends to inject vitality into your content strategy, but measure their impact to ensure they contribute positively to your benchmarks.
Educate and Entertain
Remember, the essence of social media is to be social. Your content should add value, whether by educating, entertaining, or inspiring your audience. High-quality content that resonates with your audience is more likely to exceed performance benchmarks.
Invest in What Works
Allocate resources (be it time, budget, or creativity) towards the platforms and types of content that help you meet or exceed your benchmarks. This might mean focusing more on video content if that's what your audience engages with most or investing in social media advertising for a bigger reach.

Unlock Success on Facebook With Dash Social
You’ve been able to benchmark your Facebook success, but how do you take it to the next level? With Dash Social, of course. Brands of all sizes can use Facebook Insights to not only elevate their Facebook strategy but to set their own benchmarks on the platform.
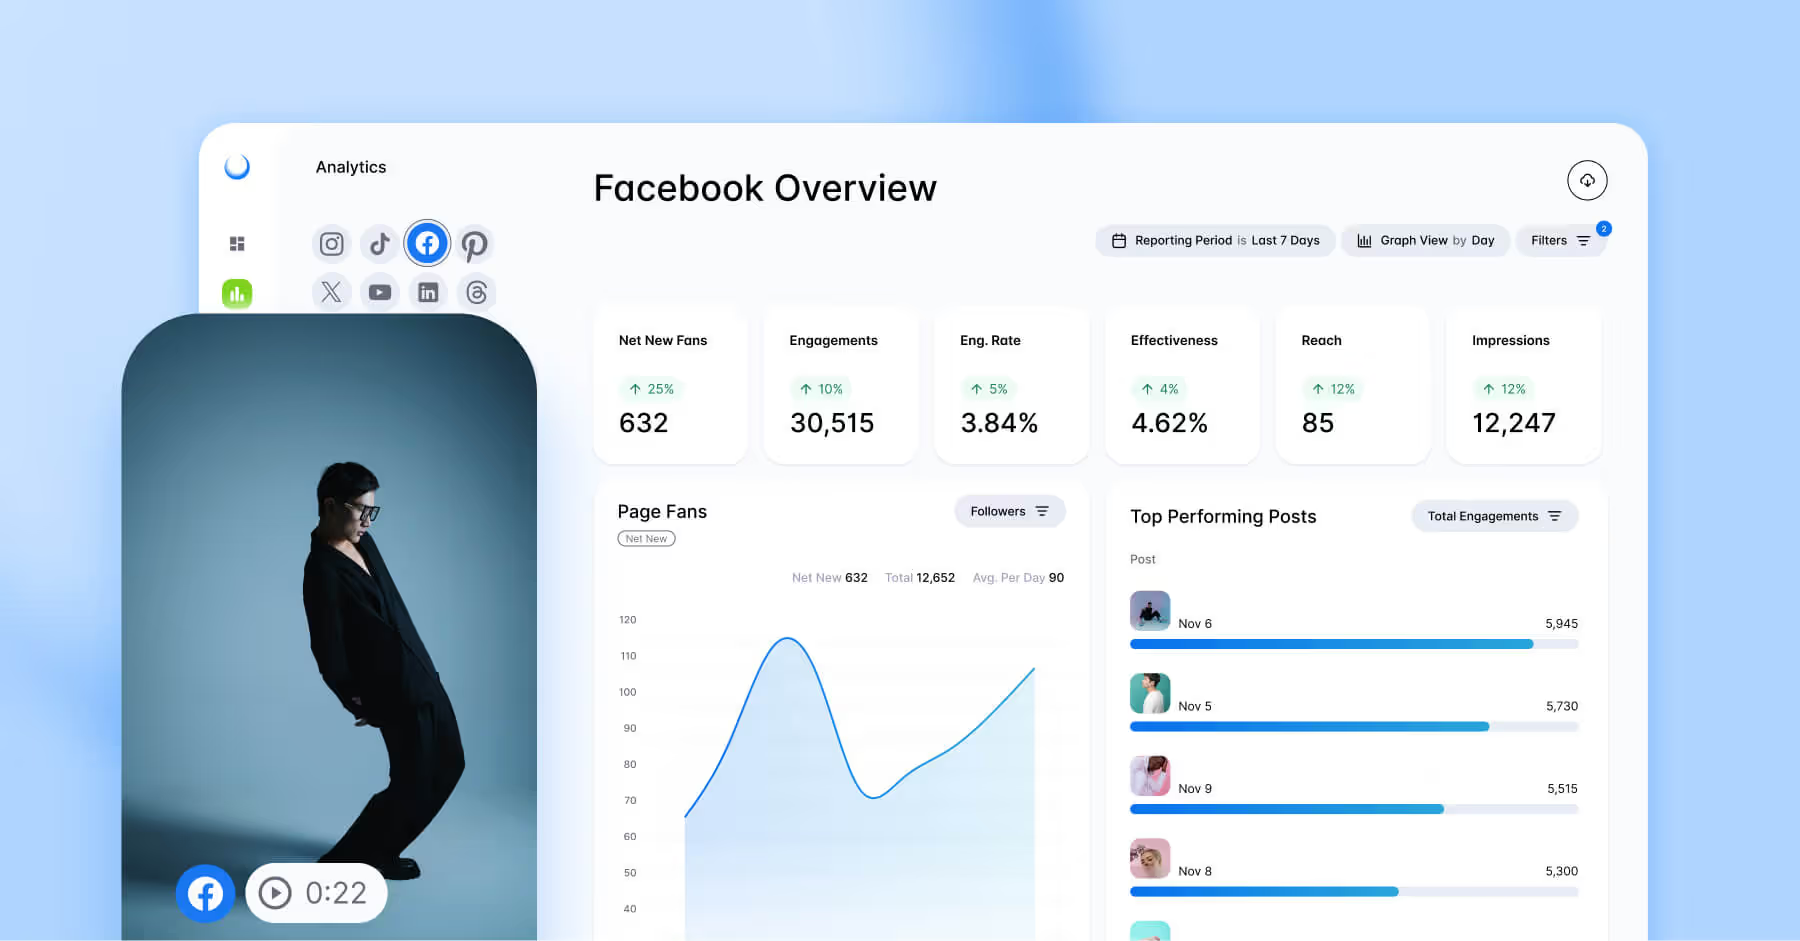
Brands can track their top-performing posts, page fans and followers, average engagement rate and average daily post viewers in one easy-to-navigate dashboard. From there, you can use ‘Your Posts’ to get post-by-post insights into how individual content types perform or Boards to see how your segmented content performs as a group.
Dash Social's Predictive Vision AI is another great tool to maximize the chance that your Facebook content resonates with your audience. This tool is woven throughout the Dash Social platform. Vision analyzes visuals from your Content Library to predict whether your content is expected to perform better or worse than average and provides visual tag suggestions. Creating actionable insights from your Facebook benchmarks has never been simpler.


.avif)